
What this means for a holder
The 200-week average is the closest thing this market has to a slow-moving centre of gravity. It is worth watching for exactly one reason: it changes so little from week to week that a large gap between price and the lineMoving averageThe average price over the last N days or weeks, recalculated every day. It smooths out daily noise so the trend underneath becomes visible.Full entry in the glossary → is genuinely unusual, and unusual is the only thing a long-horizon holder needs a chart to tell them.
Right now bitcoin is +19.4% from its line and ether is −0.0% from its own. Those two numbers describe very different situations, which is why we never average them into a single headline here. Ether has spent 90 of 350 measurable weeks below its line against bitcoin's 55, and its average has actually fallen in 30 weeks while bitcoin's has never fallen at all in our data.
The mistake to avoid is reading the line as a floor. It is an average of the past, and averages do not place bids. Price has closed weeks beneath it in every bear phase our data covers, sometimes for half a year at a time, and each of those episodes — every deep drawdownDrawdownHow far a price has fallen from its own highest point, in percent. A 60% drawdown means the price sits 60% below the peak — and needs a 150% rise just to get back to it.Full entry in the glossary → our data covers — looked at the time like the line had failed. What it is good for is scale: a price far above the line has run a long way in a short time, and a price near or under it has not.
One more caveat worth stating plainly. This line only became calculable for us on 14 Jun 2015, so everything you see here comes from a single cycle plus its edges. Statements about what happened at the 200-week average in 2015 or 2018 are external context we have not verified, and we do not repeat them as if they were ours.
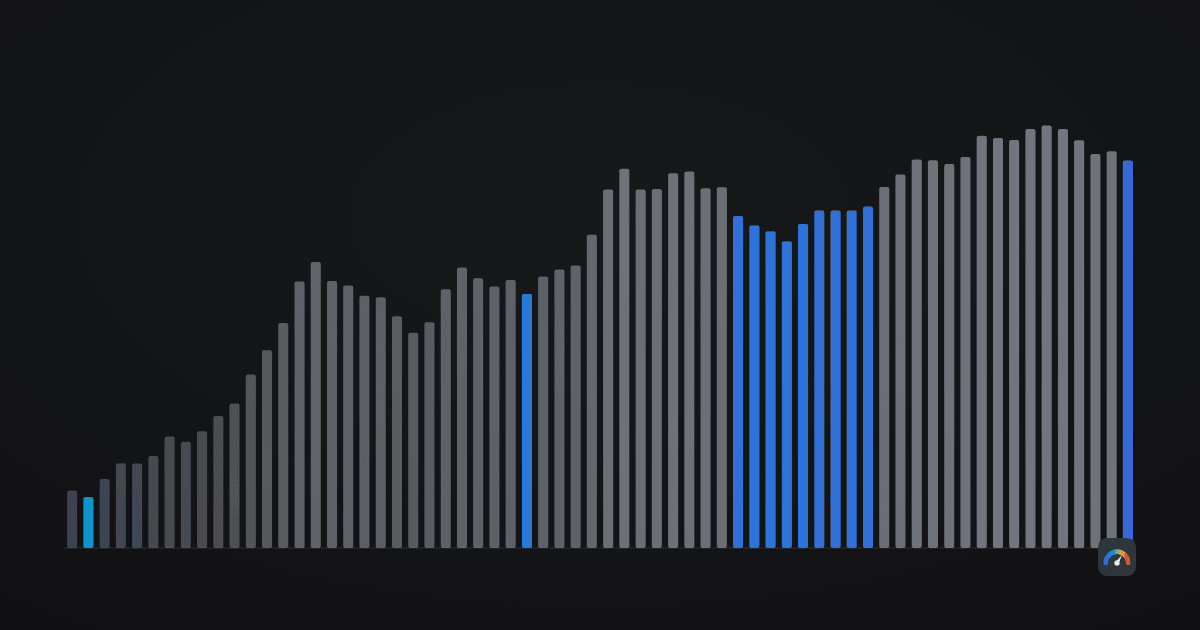
Read the full guide
The 200-Week Moving Average: Bitcoin's Long-Term Baseline
How the line is built, how often price goes under it, and why it is a context line rather than support.
Frequently asked questions
What is the 200-week moving average?
The average of the last two hundred weekly closing prices — a little under four years of history in a single line. It is the slowest baseline in common use for bitcoin, which is the point: it barely reacts to any one week, so it describes the shape of a cycle rather than the mood of a month.
Where is Bitcoin relative to its 200-week average right now?
On 14 Sep 2026 bitcoin closed at $78,173 against a 200-week average of $65,464 — +19.4%. Ether closed at $2,515 against $2,515, or −0.0%.
Has price ever traded below the 200-week average?
Yes, and more often than the folklore suggests. Of the 588 completed weeks we can measure, bitcoin closed below the line in 55 of them (9.4%) and ether in 90 (25.7%). The longest unbroken stretch below for bitcoin was 30 weeks. It is a line price spends most of its time above, not a floor it cannot cross.
Is the 200-week moving average a support level?
No. It is a context line. Nothing about an arithmetic mean of past prices obliges the next buyer to appear there, and our own data contains multi-month periods spent underneath it. Treating it as support is how people end up surprised by the ordinary.
Does the 200-week average ever fall?
For bitcoin, not once in the 587 weekly steps we can measure — each new weekly close has so far replaced an older one that was lower. Ether's average has fallen in 30 of 349 steps (8.6%). A rising line is a property of the sample we have, not a law.
Why does the line start when it does?
Two hundred weekly closes have to accumulate before there is anything to average. Our bitcoin closes begin on 18 Aug 2011, so the first 200-week average we can compute is dated 14 Jun 2015; for ether the closes begin 9 Mar 2016 and the line starts 5 Jan 2020. Everything before those dates would be someone else's number, so we do not publish it.
How this page is calculated
- Weekly closes are ISO weeks. Each week runs Monday to Sunday in UTC and its close is the Sunday daily close. A provider that closes its weeks on a different day, or in a different time zone, will draw a slightly different line.
- Weeks and days are counted differently on purpose. Counts of weeks below the line use completed weekly closes; the deepest and highest readings use daily closes, because a drawdown that happens on a Wednesday is still a drawdown. Both conventions are labelled everywhere they appear.
- The current week counts for the live reading, not for the tallies. Today's distance uses the running weekly close, matching how the Hodlometer Index computes this component; the weekly tables wait for the week to finish so the numbers do not drift from Monday to Sunday.
- Percentiles use the mid-rank convention inside a trailing 1,460-day window — the same normalisation as every other component of the index.