
The 200-Week Moving Average: Bitcoin’s Long-Term Baseline
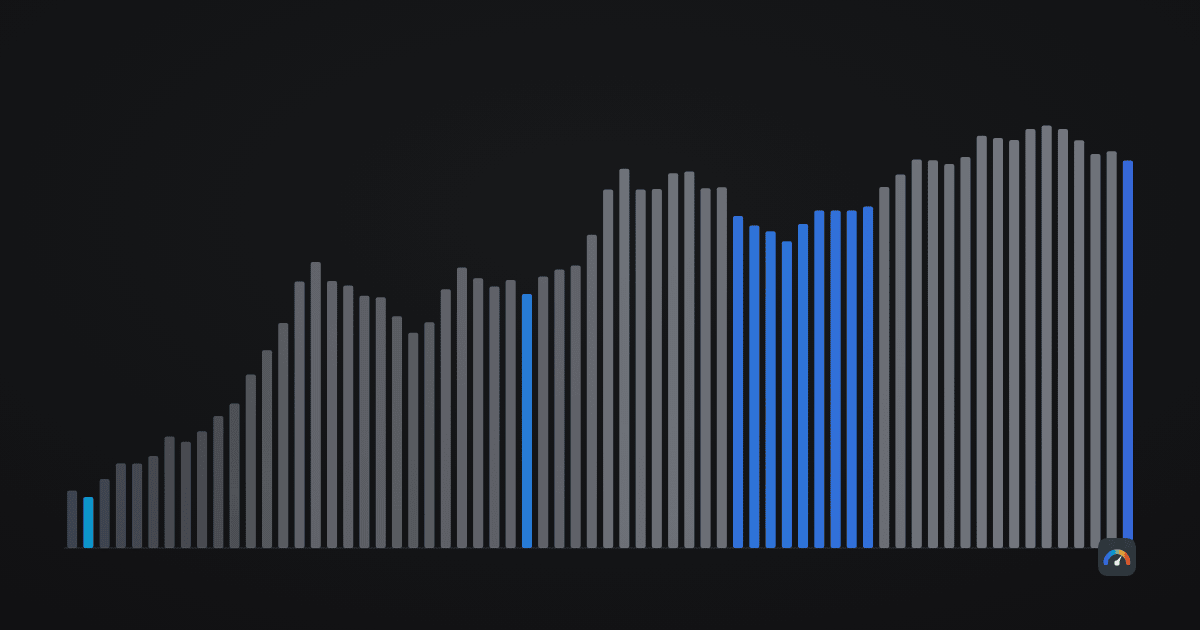
If you only had room for one line on a Bitcoin chart and you planned to hold for years rather than weeks, the 200-week moving average would be a defensible choice. It is the average weekly closing price over the last 200 weeks — very nearly four years, and therefore very nearly one halving cycle. It moves slowly enough to be almost boring, which is the point.
This article looks at what the line has actually done in our data, why it behaves differently for Bitcoin and Ethereum, and where its reputation runs ahead of the evidence.
What the line is
Take the closing price of each of the last 200 weeks and average them. Because the window is so long, a single week — even a spectacular one — moves the average by roughly half a per cent. It takes sustained change to bend it.
That slowness produces the property people find useful: the 200-week average behaves less like a signal and more like a floor level that the price occasionally visits. Since it is built from the price itself, it is not a prediction of anything. It is a summary of where the market has been trading over a full cycle.
A limitation to state up front
Computing a 200-week average requires 200 weeks of prior data. Everything below covers one fixed window — 13 June 2021 to 19 July 2026, 267 completed weeks — which is as far back as the site’s daily closes reached when this article was written. That history now starts in August 2011, so the live 200-week tool begins the line in June 2015 for Bitcoin and January 2020 for Ethereum, and its counts are larger than the ones here.
That matters because most of the confident claims made about this indicator online reference the 2015 and 2018 cycle bottoms, which sit outside our window. We are not going to repeat those claims as though we had verified them. What follows is what our own data shows, and nothing more.
For completeness, and clearly marked as outside our data: published chart analyses generally show price approaching the 200-week average near the bear-market lows of January 2015 and December 2018, and trading well below it during the March 2020 crash and through much of 2022. How deep those moves went — and whether December 2018 was a genuine break or only a touch — differs between providers, because each uses its own closes and its own week convention. We pass that on as external context, not as something we have verified.
How often price goes below it
Bitcoin closed below its 200-week average in 48 of those 267 weeks — 18.0% of the time. The longest continuous stretch below was 30 weeks, ending 12 March 2023. Measured on any single day rather than at a weekly close, the deepest reading was 34.4% below the line, on 21 November 2022.
Ethereum spent longer underwater: 56 of 267 weeks, or 21.0%, with a deepest single-day reading of 39.9% below on 8 April 2025. Its longest run below the line is 25 weeks and is still open as of the last completed week in our data.
| Measure | Bitcoin | Ethereum |
|---|---|---|
| Weeks below the 200-week MA | 48 of 267 (18.0%) | 56 of 267 (21.0%) |
| Longest run below | 30 weeks, ended 12 Mar 2023 | 25 weeks, still open |
| Deepest reading below, any day | −34.4% (21 Nov 2022) | −39.9% (8 Apr 2025) |
| Highest reading above, any day | +296.5% (20 Oct 2021) | +482.2% (5 Sep 2021) |
| Weeks the average itself fell | 0 of 266 | 35 of 266 (13.2%) |
| Latest reading | +1.3% | −24.8% |
The row that matters most
The fifth row is the interesting one. Across 266 weekly steps in our window, Bitcoin’s 200-week moving average never once declined. Not during the 2022 drawdown, not during the 2026 decline. Every week, the price dropping out of the back of the 200-week window was lower than the price entering the front of it.
Ethereum’s average is not like that. It fell in 35 of the same 266 weeks — 13.2% of the time. Its four-year baseline has periods of genuine decline, most recently reflected in the fact that Ethereum’s 200-week average has risen only 1.7% over the last twelve months, from $2,433.90 to $2,474.54. Bitcoin’s rose 25.0% over the same period, from $50,613.16 to $63,253.12.
This is not a statement that Bitcoin’s average can never fall. It is a statement that in the five years we can measure, it has not, and Ethereum’s has. If you are using the 200-week line as a mental floor, that distinction is the single most important thing on this page: the property is much weaker for Ethereum than it is for Bitcoin.
Where things stand now
As of 25 July 2026, Bitcoin trades at $64,099 against a 200-week average of $63,253 — 1.3% above the line, effectively sitting on it. Ethereum trades at $1,861 against an average of $2,475, or 24.8% below.
“Above the line” is recent, and worth saying plainly: Bitcoin was below it this summer. The weekly closes of 7 June and 28 June 2026 both came in under the average, and on 1 July price sat 6.4% below it at $58,551. That is the most recent evidence that this line is a reference level rather than a floor — and it happened weeks, not years, before this article.
For scale, at Bitcoin’s all-time high of $124,774 on 7 October 2025 price stood 131.9% above the 200-week average. Ethereum at its own high of $4,818 on 23 August 2025 stood 97.1% above. Both are a long way from the +296.5% and +482.2% peaks reached in 2021 — the same compression visible in the Mayer Multiple over the same cycles.
Within the Hodlometer Index, distance to the 200-week average carries a 30% weight and is currently the coldest of the four components, at a score of 17.2 out of 100. That score is dragged down mostly by Ethereum’s position rather than Bitcoin’s.
How to use it, and how not to
The 200-week average is a context line, not a trading rule. Three reasonable uses:
- Scaling your reaction to a drawdown. A 30% fall from a high that leaves price 100% above the four-year average is a different situation from one that takes price below it. The percentage decline alone does not distinguish them.
- Sanity-checking a headline. “Bitcoin collapses” and “Bitcoin is 1.3% above its four-year average” can describe the same day.
- Comparing assets on the same footing. The distance-to-baseline figure is directly comparable across Bitcoin and Ethereum in a way that raw prices are not.
And the failure modes:
- It is not support. Price has closed below the line in nearly a fifth of the weeks we can measure, and stayed below for over half a year at a stretch. Treating it as a floor that holds is not supported by our own data.
- Five years is not a long history. 267 weekly observations covering one full drawdown and one recovery is a description, not a distribution.
- The line will keep changing character. As the window fills with a different kind of market, the average will start behaving differently. A metric anchored to a fixed four-year window inherits whatever those four years contained.
- Weekly closes depend on where you cut the week. We use ISO weeks with UTC closes. A provider using a Sunday close in a different timezone will publish a slightly different line.
The full component weighting and normalisation are documented on the methodology page, and live versions of these charts are on the 200-week moving average tracker.
Frequently asked questions
What is the 200-week moving average?
The average weekly closing price over the last 200 weeks — very nearly four years, or one halving cycle. It moves slowly: a single week shifts it by roughly half a per cent.
Has Bitcoin ever traded below its 200-week moving average?
Yes, regularly. In our data Bitcoin closed below it in 48 of 267 weeks, or 18.0% of the time, with a longest continuous run of 30 weeks ending in March 2023 and a deepest reading of 34.4% below in November 2022. It happened again recently: the weekly closes of 7 June and 28 June 2026 were both below the line.
Does the 200-week moving average ever go down?
For Bitcoin it has not declined once across the 266 weekly steps we can measure, from June 2021 onward. For Ethereum it fell in 35 of the same 266 weeks, so the property is considerably weaker there.
Why does this article start in 2021?
Calculating a 200-week average requires 200 weeks of prior prices, and when this article was written the site’s daily closes began in August 2017 — so 13 June 2021 was the first date we could compute honestly. The price history has since been extended back to 2011 and the live 200-week tool now starts the line in June 2015 for Bitcoin and January 2020 for Ethereum. The figures in this article still describe the 2021-2026 window they were measured on.
Where is Bitcoin relative to its 200-week average now?
On 25 July 2026 Bitcoin traded at $64,099 against a 200-week average of $63,253, or 1.3% above it. Ethereum traded at $1,861 against its own average of $2,475, or 24.8% below.
Is the 200-week moving average a support level?
Our data does not support that reading. Price has closed below the line in nearly a fifth of measurable weeks, stayed below it for more than half a year at a stretch, and dipped below it again in June 2026 — reaching 6.4% below on 1 July. It is better used as a context line than as a floor.