
What this means for a holder
The useful part of this page is not the table. It is the shape of the top chart: attention is not a slow-moving background level, it is a series of spikes, and the spikes land within days of the price tops — though not reliably on the same side of them: the busiest week for the bitcoin article ended three days before the December 2017 high, and the busiest week for the ether article ended four days after the May 2021 one. In December 2017 the bitcoin article was pulling 250,717 readers a day, averaged across the week. This week it is pulling 2,929.
That would be what the end of a cycle of public interest looks like from the inside, if this is one: not a crash, just quiet. Whether quiet is an opportunity or a warning is exactly the question this data cannot answer — and the table below the charts is the honest version of the attempt. For bitcoin both extremes were followed by gains and the middle was not; but the unfiltered median over twelve months is already +58%, so the quiet decile's +92% is a modest edge over simply owning it on any random day — the signature of an asset that rose over eleven years rather than of a working indicator. For ether the same shape does not appear at all: its worst twelve-month results came from the deciles just short of mania, while the middle of its range held up. Two assets, two different patterns — which is the answer.
What this page cannot tell you
- Wikipedia is not the world. It measures people who wanted an encyclopaedia article, which skews towards the curious and the newly arrived, and away from anyone who already knows what bitcoin is. A holder checking a price does not appear here at all.
- Eleven years is three cycles at most. The series starts in July 2015 because that is where the Wikimedia pageviews API starts. Every "what happened next" number rests on a handful of genuinely independent episodes, and the windows overlap heavily.
- Attention is not demand. A news story about a hack, a court case or a national ban sends readers to the article just as reliably as a rally does. The series cannot tell those apart, and neither can we.
- English only. One language edition of one encyclopaedia. Interest in markets that do not read English is invisible here.
How this page is calculated
- Source. Wikimedia REST pageviews API, English Wikipedia,
all-access,agent=user— automated traffic is excluded by Wikimedia before we see it. Articles: Bitcoin and Ethereum. Data available from 1 July 2015 onward. - Attention. The trailing seven-day mean of daily pageviews. Percentile is the rank of that mean among every seven-day mean in the series.
- The table. For each day with at least a year of prior history, the attention rank is computed against only the days before it, then bucketed into tenths. Price changes come from the same daily closes that feed the rest of the site. Cells show the median.
- Attribution. Pageview data is published by the Wikimedia Foundation under CC0.
Read the full guide
Does public attention lead the bitcoin price, or follow it?
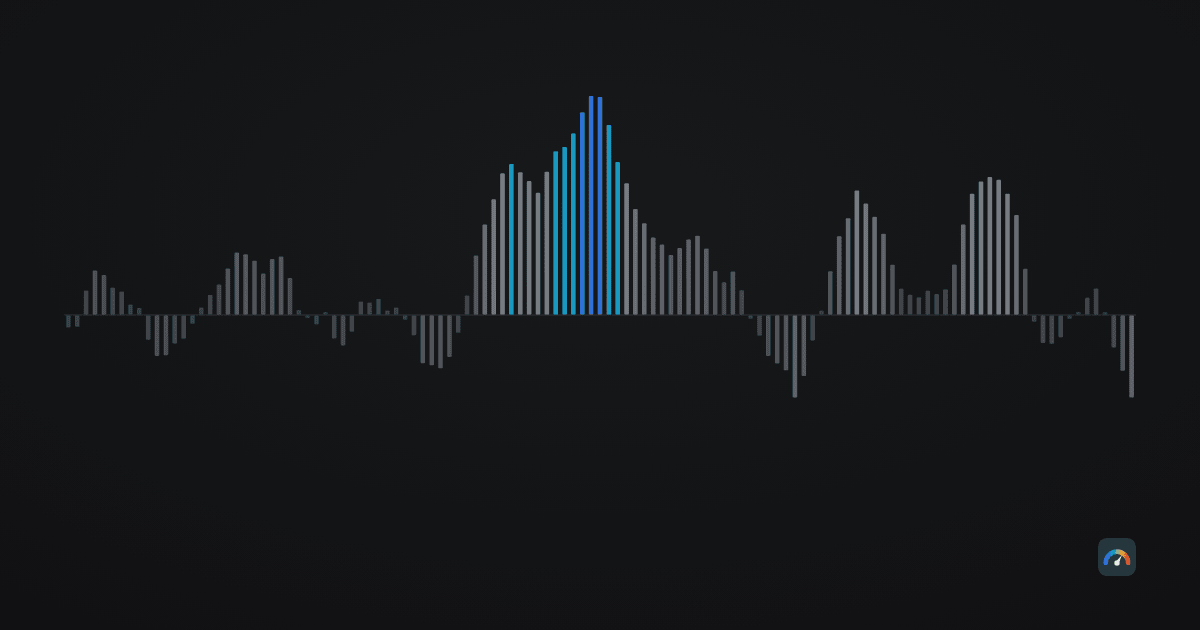
Across every lag from −60 to +60 days the strongest link between readership and price is +0.12 — one day after the move, not before it.
Frequently asked questions
Is this Google Trends?
No, and the difference matters. Google's own Trends API has been in closed alpha since July 2025 and the endpoint behind the popular scraping libraries refuses automated requests, so no honest site can promise you Google search interest for free. This page uses English Wikipedia pageviews instead: the count of people who opened the "Bitcoin" or "Ethereum" article on a given day, published openly by the Wikimedia Foundation with automated traffic already filtered out. It is a different measure of the same thing — how many people are curious enough to go read.
Why the seven-day average?
Because the daily series has a weekday rhythm: fewer people read encyclopaedias at the weekend. A seven-day average removes that without smoothing away the spikes that actually matter, and every number on this page — today's reading, the percentile, the table — is computed on the same seven-day basis.
What does the percentile mean?
Where the last seven days rank among every seven-day stretch since 7 Jul 2015. A reading in the 5th percentile means attention has been higher than this on 95% of days in eleven years. It is a rank inside this one series, not a share of the world's population.
Does low attention mean it is time to buy?
No, and the table below is the reason rather than the proof. For bitcoin it shows the quiet end and the manic end both preceding gains while the middle did not — a shape that says more about an asset which rose over eleven years than about attention. For ether the same table does not hold that shape at all: its worst twelve-month outcomes came from the deciles just short of mania — the 70th to 90th percentile of attention — while the middle of its range was mildly positive. Two assets, two different patterns, one price history each. That is what a coincidence looks like, and it is why nothing here is a signal. See what this site refuses to do.
How fresh is it?
Wikimedia publishes with a one to two day lag, so the last point is normally yesterday or the day before. Our cron collects the series daily and the page states its own as-of date above.
Data through 14 Sep 2026 · All tools