
Does public attention lead the bitcoin price, or follow it?
Every rally arrives with the same background noise: friends asking what a wallet is, headlines about a new record, a sudden crowd who want the thing explained. It looks like a leading indicator, and it is testable — because every one of those people has to go and read something.
The short answer, from eleven years of daily readership of the English Wikipedia article Bitcoin: attention follows price, and the lag is about a day. Across lags from −60 to +60 days the strongest correlation between weekly changes in readers and weekly changes in price is +0.12, one day after the price moved — and the whole curve leans that way, with the shoulder on the price-first side running about twice as high as its mirror image. Nothing anywhere in the four-month window comes close to being a signal you could act on. Meanwhile the crowd has left: the bitcoin article is being read by 2,271 people a day, the quietest week in the entire record.
If you read nothing else: neither a crowd nor its absence tells you anything in advance. The largest correlation anywhere in a four-month window is +0.12, against a noise band of ±0.08 — barely outside it, and on the side where the price moved first. A spike is a receipt for a move that has already happened. Quiet is not a buy signal either: the six quiet spells since 2019 are six observations, all of them recent, and the newest one is still running and is 15.3% lower twelve months in. What attention is genuinely good for is calibrating your own reaction — noticing that the room is empty, and that emptiness is exactly when a schedule you set in advance does its work. Nothing here is a forecast or advice.
All figures below come from our own tables: daily English Wikipedia pageviews for 22 crypto-adjacent topics since 1 July 2015 — published by the Wikimedia Foundation with automated traffic already filtered out — joined to our daily UTC bitcoin closes through 29 July 2026, 4,047 days where both exist. The live series and today’s reading are on the attention tool; this is the explanation that page has no room for. It describes what has already happened. It is not a forecast and not advice.
First, the mistake that makes this question look easy
Put readers and price on the same chart and the relationship looks obvious. Measure it, and the number you get depends entirely on which years you happened to plot.
Correlate the level of readership against the level of price across 2016 and 2017 and you get +0.92 — near-perfect agreement, the kind of number that ends arguments. Do the same across all eleven years and you get −0.27: attention and price apparently move in opposite directions. Do it across 2023 to today and you get −0.01: no relationship at all. Same two series, same arithmetic, three incompatible answers.
The reason is that a correlation of levels is mostly a correlation of trends. Bitcoin’s price has trended up over eleven years; Wikipedia readership of almost everything has trended down as people ask other things instead. Two lines that drift steadily in opposite directions will produce a strong negative correlation whether or not they have anything to do with each other, and two lines that drift the same way will produce a strong positive one. Pick a window where both were climbing — 2016–2017 — and the trend does all the work.
The fix is to stop asking where the two series are and ask what they did: correlate the change in readership over a month against the change in price over the same month. That number is +0.31 across all eleven years, and it stays positive in every sub-window — +0.53, +0.22, +0.23. Weaker than the flattering levels number, and real. Everything from here on is computed on changes.
The answer, at every lag from −60 to +60 days
The test is mechanical: take the weekly change in readers, take the weekly change in price, and slide one against the other a day at a time. If attention led the market, the correlation would peak to the right of zero — attention first, price catching up. If attention merely reacts, the peak sits at or just left of zero.
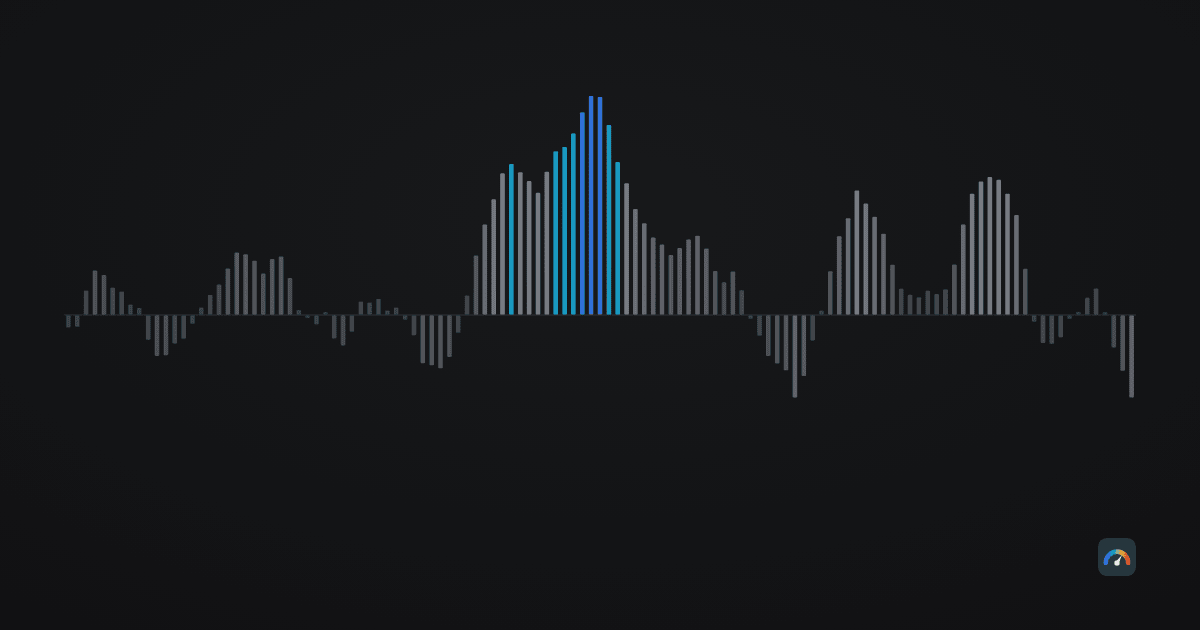
The curve is a single hump centred on zero, and it peaks at lag −1: +0.12, meaning today’s change in readers lines up best with yesterday’s change in price. The same-day reading is +0.12 as well; the two are indistinguishable. What is not symmetrical is the decay. Ten days on the price-first side reads +0.09; ten days on the attention-first side reads +0.04. Seven days: +0.07 against +0.04. The relationship survives longer looking backwards than forwards, which is the shape you get when one series is reacting to the other.
Those 4,040 rows are fewer facts than they look. Taking a 7-day change every day means each window shares six of its seven days with the one before it, so neighbouring rows are near-copies rather than new evidence; the information in them is roughly that of 577 separate weeks, which is what the shaded band on the chart is sized on. Run the same test on those 577 non-overlapping calendar weeks directly and you get the honest version: price in the previous week, +0.12; price in the same week, +0.10; price in the following week, +0.05. The standard error is 0.04 — a noise band of about ±0.08 either side of zero — so the backward-looking number is roughly three standard errors out and the forward-looking one is barely one. One caveat on that “roughly”: the ±0.08 band assumes each week is independent of the last, and even on non-overlapping weeks the attention changes still carry a residual week-to-week correlation of −0.30, so treat three standard errors as an order of magnitude rather than an exact bar. And “distinguishable from zero” is a much smaller claim than it sounds: a correlation of 0.12 accounts for under two per cent of the variation in either series, so the relationship is real enough to measure and far too weak to trade. That is the whole finding.
One more number from those 577 weeks is worth more than the lead-lag question. Correlate the change in readers with the size of the price move, sign discarded: +0.16, higher than the signed +0.10. Readers turn up for drama in either direction — which is why attention is not sentiment. Our Fear & Greed gauge tries to measure which way the mood points, and what that is worth to a long-term holder is its own article; attention only measures how loud the room is.
The ten loudest weeks in eleven years
Correlations describe the average day; the peaks describe the days people remember. Below are the ten busiest weeks for the bitcoin article, kept at least 120 days apart so one episode cannot fill the table, with what the price had done in the previous thirty days and what it did over the following ninety.
| Week ended | Readers a day | BTC then | Previous 30 days | Next 90 days |
|---|---|---|---|---|
| 13 Dec 2017 | 250,717 | $16,033 | +148.0% | −42.9% |
| 28 May 2017 | 61,099 | $2,179 | +63.7% | +99.1% |
| 14 Feb 2021 | 40,343 | $48,578 | +32.2% | −3.7% |
| 8 May 2016 | 30,946 | $458 | +9.7% | +28.6% |
| 28 Sep 2021 | 30,185 | $41,027 | −15.9% | +23.6% |
| 11 Jun 2018 | 26,118 | $6,872 | −18.8% | −9.0% |
| 14 Dec 2015 | 21,894 | $443 | +33.1% | −6.8% |
| 8 Jan 2017 | 21,502 | $910 | +18.2% | +30.1% |
| 11 Dec 2024 | 18,104 | $101,125 | +14.1% | −18.0% |
| 11 Mar 2024 | 16,007 | $72,078 | +50.9% | −3.4% |
| Median of the ten | — | — | +25.2% | −3.6% |
Eight of the ten peaks arrived after a rising month, and the median rise into them was +25.2%. Over the ninety days after them the median was −3.6%, and only four of the ten were higher. The busiest week in the entire record, ending 13 December 2017 at 250,717 readers a day, ended three days before that cycle’s highest close; ninety days later bitcoin was 42.9% lower.
It is easy to over-read that. Ten peaks is ten observations, five of them from 2017 and 2021 alone, and the two that arrived after a falling month — June 2018 and September 2021 — went on to do opposite things. The table supports a modest claim: crowds have arrived after the move, near the end of it more often than not. It does not support a rule for selling.
Which topics are bullish, and which are bearish?
This section tests the reverse hypothesis, and it earns its place by failing. If no single article leads the price, perhaps the mix does: Coinbase and Ethereum filling up in rallies, Bear market, Cryptocurrency bubble and Mt. Gox — the encyclopaedia entries of fear — filling up in crashes, with the balance between them serving as a mood gauge. To check, every 30-day window since May 2018 is sorted by bitcoin’s move over it and split into fifths: worst fifth a median −18%, best fifth +31%.
Almost every topic is read more when the price rises, the fearful ones included. Cryptocurrency bubble gains readers in bad months (+8.2%) and gains more in good ones (+21.1%) — people look up “bubble” during the rally, while asking whether this is one. Mt. Gox is the same shape smaller (+2.4% against +11.9%). Only Bear market (+2.4% against −2.0%) and Volatility (finance) (+0.1% against −0.7%) lean the other way at all, and both are generic finance articles.
Both leans are inside the noise — the same fact measured a second way. Rather than comparing two ends of a ranking, correlate each topic’s readership change directly against the price change over the same window: Bear market, the most bearish-looking row in the chart, reads −0.15 against a noise band of roughly ±0.20. There is no bearish half of the crowd to measure, and so no mood gauge to build — only a split between topics that respond to good news alone (Coinbase, Binance, Proof of stake) and topics that respond to trouble as well, the ones about failures, pegs and leverage.
And when nobody is looking?
Which brings us to now. The trailing seven-day average of readers is 2,271 a day, and only three readings in eleven years sit below it — all three from the previous three days. The four quietest weeks on record are the four most recent. The bitcoin article was read 110 times more heavily in December 2017 than it is today, and ether’s article, at 633 readers a day, is at its 3rd percentile.
What has followed quiet before? To answer without cheating, each day is ranked against only the days before it — a 2019 observer cannot be credited with knowing about the 2021 peak — and days below the 5th percentile of their own past are merged into spells. Returns run from the first day of a spell, not the last: a spell ends when attention picks up, and attention picks up after the price moves, so measuring from the end would measure from the moment the market had already started. Read the six rows below as six anecdotes rather than as a distribution — the whole reason they are worth showing is that there are too few of them to average, and the last of the six has not finished.
| Quiet spell began | Ran for | BTC then | Next 90 days | Next 12 months |
|---|---|---|---|---|
| 21 Jan 2019 | 542 days | $3,527 | +49.0% | +147.7% |
| 18 Sep 2020 | 29 days | $10,933 | +108.5% | +341.7% |
| 10 Aug 2022 | 431 days | $23,954 | −22.6% | +23.0% |
| 19 Dec 2023 | 5 days | $42,276 | +59.9% | +137.0% |
| 13 May 2024 | 169 days | $62,940 | −6.7% | +65.4% |
| 4 May 2025 | 452 days, still running | $94,278 | +19.4% | −15.3% |
Five of the six spells saw a higher price twelve months later; across all six, the median twelve-month change was +101.2% — a figure that includes the one negative reading, not a median of the five winners. The forward-return table on the attention tool says something similar from a different angle: the quietest tenth of days produced a 12-month median of +96.2% against +59.4% for all days without any filter.
Now the reasons not to trust it, which are larger than the finding. Six spells is six observations, and the forward years of the last three overlap each other, so the effective count is nearer four. All six are recent — no day before 2019 qualifies, because attention has drifted structurally lower and “quiet against its own past” increasingly just means “lately”. That makes this a sample drawn almost entirely from a stretch in which bitcoin happened to rise, which is why the unfiltered +59.4% matters so much: most of the quiet decile’s advantage is the advantage of owning an asset that went up. And the sixth spell is the one we are inside. It began on 4 May 2025, every day since has stayed below the 5th percentile of its own past, and today’s record-low reading sits within it — 452 days and counting. Its first twelve months returned −15.3%, and it has not resolved: it has not ended in the crowd coming back, it has simply run out of data. The counterexample is not a finished episode from the archive. It is the one being lived through while you read this.
Bitcoin closed at $63,917 on 29 July 2026, 48.8% below its October 2025 record. Whether the silence around that is exhaustion or indifference is not something 4,047 rows can settle; the history of past drawdowns is a better place to calibrate how long such stretches run.
What Wikipedia pageviews cannot tell you
- This is not search demand, and it is English only. It counts people who opened an encyclopaedia article, which skews hard towards newcomers and away from anyone who already knows what bitcoin is; a holder checking a price never appears. Google’s own Trends API has been in closed alpha since July 2025, so nobody publishing for free can honestly offer search interest instead. And whatever Korea, Turkey or Brazil are curious about is invisible here.
- A single news story can be the whole spike. The busiest day ever for Bear market and for Dollar cost averaging was the same day — 12 March 2020, when bitcoin fell 39.5% along with everything else, an equity-market event rather than a crypto one. Tether and Stablecoin both peaked on 12 May 2022. Topics move in bundles when one story lands, and the series cannot tell a story from a trend.
- Some spikes are probably not people. Wikimedia filters known automated traffic, but not perfectly, and redirects route readers strangely. Cryptocurrency wallet recorded 81,571 views on 1 December 2021 — 329 times its own median day, with nothing in the price to explain it. We leave outliers in rather than quietly deleting what we cannot explain, which is why the comparisons above use medians and ranks.
- Eleven years is three cycles. The series begins on 1 July 2015 because that is where the Wikimedia API begins, and the two largest peaks belong to one year. Two of our 22 topics were unusable: the Bitcoin halving and Halving articles were created in September 2023 and June 2025 and are excluded throughout. When an article exists at all is itself a fact about attention — Cryptocurrency bubble was created on 17 December 2017, the week of the peak.
What a holder does with this
Three things, none of them a trade.
- Stop treating the crowd as information. The measured lead is one day, in the wrong direction. By the time your feed is full of bitcoin, the move that filled it has already happened.
- Use quiet as context, not as a trigger. The historical record after quiet is favourable, thin, recent, and contradicted by the one episode that is still open — the one containing today. A mechanical schedule that does not care what the room sounds like — the case for it is in our DCA guide — is the boring alternative, and boring is the point.
- Check the levels trap on any chart you are shown. Two lines rising together over a decade will correlate at +0.9 no matter what they are. Ask whether the number was computed on levels or on changes; if nobody says, assume levels.
The live readings, the full series since 2015 and the decile table are on the attention tool. How every series on this site is built is in the methodology, and unfamiliar words are in the glossary.
Frequently asked questions
Does public attention predict the bitcoin price?
Not in this data. Across lags from −60 to +60 days, the strongest correlation between weekly changes in Wikipedia readership and weekly changes in price is +0.12 one day AFTER the price moved. On 577 independent calendar weeks, price in the previous week correlates +0.12 with readership, price in the following week only +0.05 — about one standard error from zero.
Why measure changes instead of levels?
Because a correlation of levels is mostly a correlation of trends. Correlating the level of bitcoin readership against the level of price gives +0.92 over 2016–2017, −0.27 over all eleven years and −0.01 over 2023–2026. The same test on 30-day changes gives +0.31 overall and stays positive in every sub-window.
What happened after the biggest attention spikes?
The ten busiest weeks for the bitcoin article came after a median 30-day rise of +25.2%, and the median 90 days after them was −3.6%, with only four of ten higher. The record week ended 13 December 2017 — three days before that cycle’s highest close — and bitcoin was 42.9% lower ninety days later. Ten peaks is ten observations.
Which crypto topics are read during crashes?
Almost none, on this evidence. Of twenty topics with a full history since May 2018, only Bear market and Volatility (finance) are read slightly more in bitcoin’s worst months than its best, and both leans are within noise. Cryptocurrency bubble and Mt. Gox do gain readers in bad months, but they gain more in good ones.
Bitcoin attention is at a record low — is that bullish?
It is context, not a signal. Of six quiet spells since 2019, five saw a higher price twelve months later, and the median across all six was +101.2% — but all six are recent, their forward windows overlap, and the unfiltered 12-month median for any day at all is already +59.4%. The sixth spell also has not ended: it began on 4 May 2025, today’s reading is inside it, and its first twelve months returned −15.3%.
Is Wikipedia readership the same as Google Trends?
No. It counts people who opened an encyclopaedia article on English Wikipedia, with automated traffic filtered by Wikimedia before publication. It skews towards newcomers, excludes every non-English reader, and can be moved by a single news story — the busiest day ever for both Bear market and Dollar cost averaging was 12 March 2020, an equity-market crash.