
Bitcoin vs Ethereum for the Long Run: What Holders Should Track
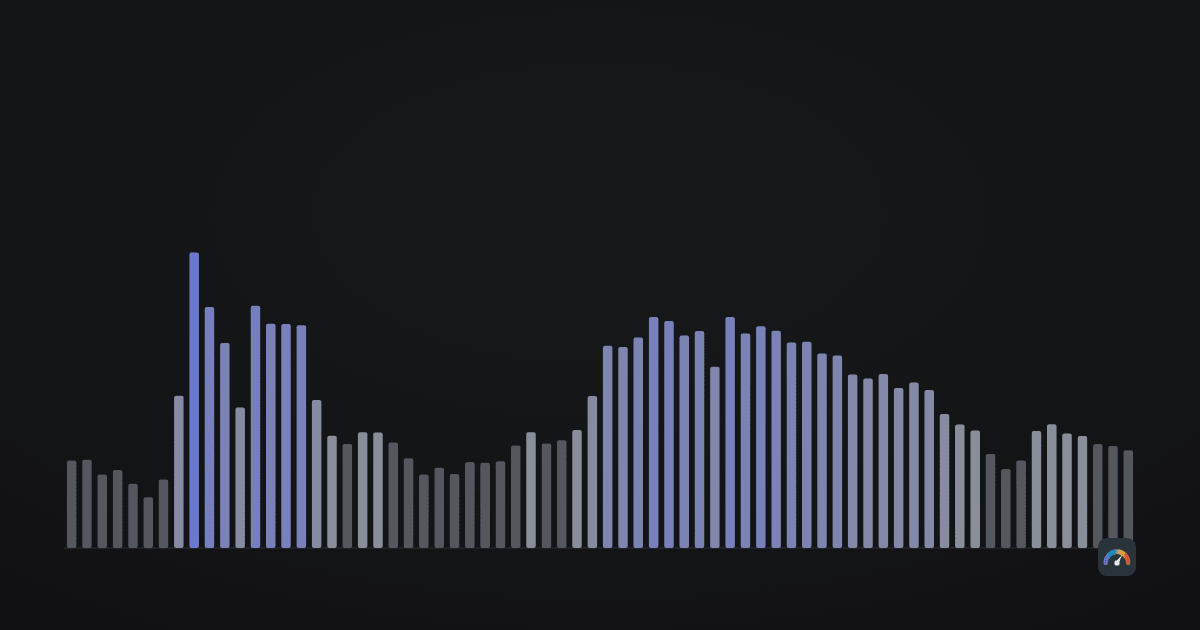
Most Bitcoin-versus-Ethereum arguments are really arguments about what the two assets are for. Those are worth having, but they are not resolvable with a price database. What a price database can do is describe how the two have actually behaved next to each other, which turns out to be more informative than most of the debate.
All figures below come from one fixed window of daily closes, 17 August 2017 to 26 July 2026 — 3,266 observations for each asset, spanning two halvings and one complete halving cycle. That window is where the two assets share an exchange series; our Bitcoin closes now start in August 2011 and our Ethereum closes in March 2016, and a longer window would give different numbers.
The headline comparison
| Measure | Bitcoin | Ethereum |
|---|---|---|
| Price, 17 Aug 2017 | $4,285 | $302 |
| Price, 26 Jul 2026 | $65,400 | $1,955 |
| Total return | 15.26× | 6.47× |
| Annualised return | 35.6% | 23.2% |
| Annualised volatility | 68.0% | 87.8% |
| Highest daily close | $124,774 (6 Oct 2025) | $4,818 (22 Aug 2025) |
| Currently below that high | −47.6% | −59.4% |
| Deepest drawdown in this window | −83.2% (15 Dec 2018) | −94.0% (15 Dec 2018) |
Over this specific window Bitcoin returned more with less volatility. That is a genuinely one-sided result, and it deserves the obvious caveat: it depends heavily on the start date. Beginning in mid-2017 catches Ethereum after a large run-up. A window starting in 2019 would look different. Single-window comparisons of two assets over nine years are not evidence about the future, and anyone presenting them as such is selling something. The version without a chosen start date is holding period returns, which runs every day in our history as an entry point and shows the whole spread of outcomes for one, two and four years of holding.
The drawdown row is more durable than the return rows. Ethereum fell 94% from its peak at the end of 2018 against Bitcoin’s 83%, and today sits further below its high. Higher volatility in both directions is a persistent structural feature, not an artefact of the window.
Year by year
| Year | Bitcoin | Ethereum | Winner |
|---|---|---|---|
| 2018 | −72.3% | −82.6% | BTC |
| 2019 | +89.5% | −7.1% | BTC |
| 2020 | +301.7% | +463.1% | ETH |
| 2021 | +57.6% | +404.3% | ETH |
| 2022 | −65.3% | −68.2% | BTC |
| 2023 | +154.5% | +90.1% | BTC |
| 2024 | +111.8% | +41.9% | BTC |
| 2025 | −6.5% | −11.7% | BTC |
Ethereum outperformed in two of eight complete calendar years — but those two years were enormous, which is precisely the pattern a higher-volatility asset produces. Betting on Ethereum has historically meant being wrong most years and occasionally very right. That is a different psychological proposition from a steadier compounding profile, even when the long-run numbers end up similar.
The ratio holders actually watch
Comparing dollar prices mixes two questions: how crypto did against cash, and how Ethereum did against Bitcoin. The ETH/BTC ratio isolates the second.
| ETH/BTC | Value | Date |
|---|---|---|
| Current | 0.02904 | 25 Jul 2026 |
| Median of our history | 0.04053 | — |
| Highest | 0.11295 | 1 Feb 2018 |
| Lowest | 0.01642 | 6 Sep 2019 |
| Start of our data | 0.07048 | 17 Aug 2017 |
Only 22.1% of the days in our history had a lower ratio than today’s. Measured in Bitcoin rather than dollars, Ethereum is near the weaker end of its historical range — and the current reading is well below the 0.04053 median. Whether that reads as an opportunity or as a trend depends on assumptions the data cannot supply.
The ratio is also a useful antidote to a common reporting error. In a broad decline both assets fall in dollars, and headlines describe them as moving together. The ratio can be falling sharply at the same time, which means an Ethereum holder is losing twice: once against cash and once against the alternative crypto holding. Since the start of our data the ratio has gone from 0.07048 to 0.02904 — Ethereum has lost roughly 59% of its value measured in Bitcoin over nine years, during a period in which its dollar price rose more than sixfold. Both statements are true, and only one of them usually gets reported.
They move together more than apart
The correlation of logarithmic daily returns across the full period is 0.797. Over the last 365 days it is 0.865.
This is the number most often ignored in allocation debates. At a correlation approaching 0.9, holding both assets is not diversification in any meaningful sense — it is one position with two tickers. On the days that matter, both fall. What a split does provide is protection against being wrong about a specific asset: a protocol-level failure, a regulatory action aimed at one and not the other, a shift in which asset institutional capital prefers. That is a real risk and worth hedging. It is simply not the same thing as reducing exposure to crypto as a whole.
Where the two genuinely differ
Beyond returns, four structural differences show up consistently in our metrics.
The long-term baseline behaves differently. Across 267 weekly steps since June 2021, Bitcoin’s 200-week moving average never declined once. Ethereum’s fell in 30 of those weeks — 11.2% of the time. Over the last twelve months Bitcoin’s four-year baseline rose 25.1%; Ethereum’s rose 1.8%. If you rely on the 200-week average as a mental floor, that reliance is much better founded for Bitcoin.
Ethereum’s tails are wider. On the Mayer Multiple — price against its own 200-day average — Bitcoin’s 10th and 90th percentiles sit at 0.712 and 1.509. Ethereum’s sit at 0.615 and 1.614. Ethereum also spent 21.3% of weeks below its 200-week average against Bitcoin’s 17.5%, with a deeper worst reading of −39.9% against −34.4%.
Their positions right now are not comparable. Bitcoin sits 3.2% above its 200-week average; Ethereum sits 21.1% below. That single divergence is the largest driver of the Hodlometer Index’s coldest component today, and it is why the index blends the two assets rather than tracking either alone.
One of them pays you to hold it. Every figure in this article is a price, and for bitcoin price is the whole return — holding it pays nothing. Ether is different: staking pays a staker in new ether, so a staked position earns something the price series never shows. A price-based comparison of the two is therefore a comparison of price returns, which is consistent across both assets and incomplete for ether. We do not publish a total-return series for it, because doing so honestly needs a yield history per provider plus assumptions about compounding, fees and lock-ups that we cannot verify. Stating the gap is the accurate thing to do; filling it with an estimate would not be. Staking also brings its own lock-ups, slashing and, through a service, counterparty risk — none of which the price captures either.
What is worth tracking
If you hold both and want a short list rather than a dashboard:
- ETH/BTC ratio against its own history. One number that answers “is my Ethereum position doing anything my Bitcoin position is not?”
- Distance to each 200-week average, separately. The two assets diverge most on this measure, and the divergence is currently large.
- Rolling correlation. When it rises toward 0.9, a split is doing less than it appears to.
- Your actual allocation drift. After a year in which one asset outperforms by 200 percentage points, a 70/30 split is no longer 70/30 unless you rebalanced.
Every item on that list compares the two majors with each other. The other half of the question is how either of them looks next to what you would otherwise be holding: bitcoin and ether against the S&P 500 and gold puts the same $100 into all four on the same trading days, and prints the drawdown each of them cost along the way next to the return.
The one thing the data will not do is settle the argument. Nine years, one complete cycle and two assets is not enough to establish which is the better long-run holding, and any analysis claiming otherwise is over-reading a small sample. What the numbers do support is a narrower conclusion: the two are far more alike in their movements than the discourse suggests, and where they differ, they differ in volatility and in the reliability of their long-term baseline rather than in direction.
The 70/30 blend used in our own index is documented on the methodology page, and the live figures for both assets sit side by side on the markets page.
Frequently asked questions
Which has performed better, Bitcoin or Ethereum?
Over the window this article uses, 17 August 2017 to 26 July 2026, Bitcoin returned 15.26× against Ethereum’s 6.47×, with lower volatility. That result is window-dependent: a different start date would give a different answer.
How correlated are Bitcoin and Ethereum?
Daily logarithmic returns correlate at 0.797 across the full period and 0.865 over the last 365 days. At that level, holding both reduces the risk of being wrong about one asset far more than it reduces exposure to the market as a whole.
What is the ETH/BTC ratio and why does it matter?
It is Ethereum’s price expressed in Bitcoin, which isolates relative performance from the market’s overall direction. It currently reads 0.02904 against a historical median of 0.04053, and only 22.1% of days in our data were lower.
Has Ethereum ever outperformed Bitcoin?
Yes, in two of the eight complete calendar years in our data: 2020, when Ethereum returned 463.1% against Bitcoin’s 301.7%, and 2021, when it returned 404.3% against 57.6%.
Which is more volatile?
Ethereum, consistently. Annualised volatility over this window is 87.8% against Bitcoin’s 68.0%, and inside it Ethereum’s deepest drawdown is 94.0% against Bitcoin’s 83.2%.
Should a long-term holder own one or both?
The data cannot answer that. Nine years covering one complete halving cycle is not enough to establish which is the better long-run holding, and any analysis claiming otherwise is over-reading a small sample.