
DCA into Bitcoin and Ethereum: A Holder’s Guide
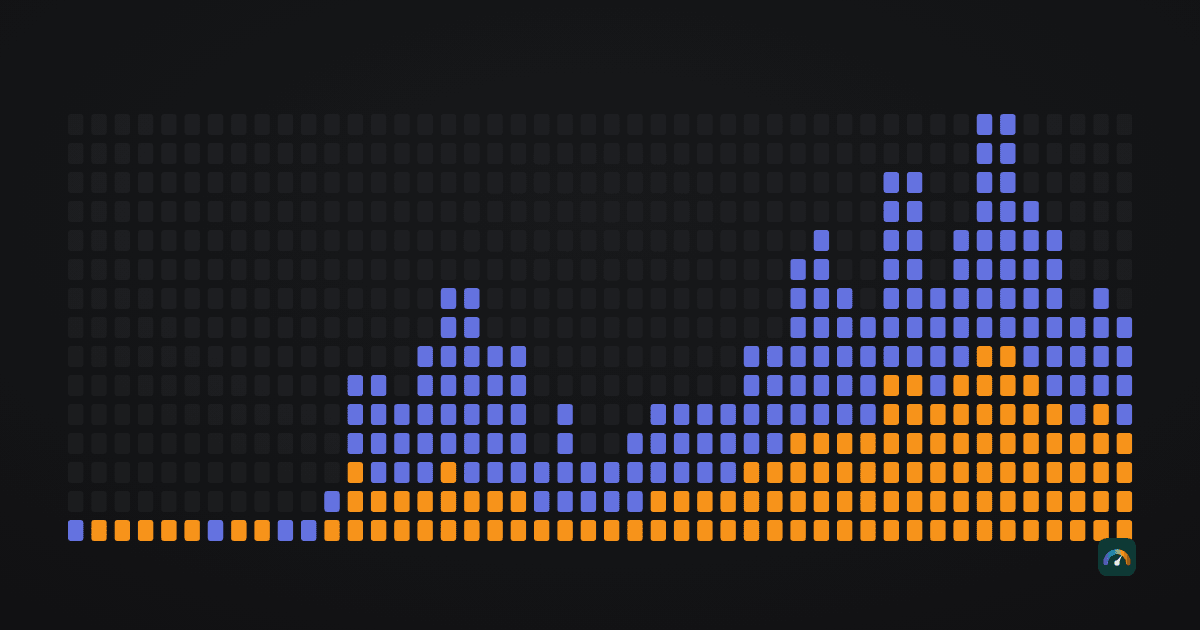
Dollar-cost averaging is buying a fixed amount on a fixed schedule regardless of price. It is the least exciting thing you can do with an asset this volatile — annualised volatility across our data runs at 67% for bitcoin and 87% for ether — and that is most of its appeal: it removes the decision that most people get wrong, which is deciding when.
What follows is not advice about whether to do it. It is what the strategy would have produced on our own price data, including the cases where it produced a loss. All figures assume $100 bought every Monday, run through 25 July 2026, with no fees and no taxes — both of which would reduce every result below.
The mechanic behind it
Buying a fixed dollar amount means you automatically buy more units when price is low and fewer when it is high. The result is that your average cost per unit is always lower than the average price over the same period. That is arithmetic, not strategy, and it holds regardless of what the market does.
What it does not do is guarantee a profit. If the price at the end is below your average cost, you are down. Dollar-cost averaging changes the shape of the outcome, not its sign.
What it would have produced
Four start dates, chosen to span the useful range: the beginning of our data, the start of 2020, the week of the November 2021 cycle peak, and the start of 2024.
| Start | Asset | Invested | Value on 25 Jul 2026 | Average cost | Result |
|---|---|---|---|---|---|
| 21 Aug 2017 | BTC | $46,600 | $200,577 | $14,892 | +330.4% |
| 21 Aug 2017 | ETH | $46,600 | $163,101 | $532 | +250.0% |
| 6 Jan 2020 | BTC | $34,200 | $77,553 | $28,267 | +126.8% |
| 6 Jan 2020 | ETH | $34,200 | $62,970 | $1,011 | +84.1% |
| 8 Nov 2021 | BTC | $24,600 | $37,703 | $41,823 | +53.3% |
| 8 Nov 2021 | ETH | $24,600 | $20,800 | $2,201 | −15.4% |
| 1 Jan 2024 | BTC | $13,400 | $11,296 | $76,035 | −15.7% |
| 1 Jan 2024 | ETH | $13,400 | $9,346 | $2,669 | −30.3% |
Two of the eight rows are losses, and both are recent. That is the honest picture: dollar-cost averaging into a volatile asset produces a loss whenever the accumulation period has not yet been followed by a recovery. Anyone who started in 2024 is currently down between 16% and 30% depending on the asset, having done nothing wrong.
The worst start we can test
The 8 November 2021 row deserves attention, because it is the case people worry about: starting the week of a cycle peak, with Bitcoin at $67,526 and Ethereum at $4,808.
Buying Bitcoin in one lump on that day would have turned $24,600 into $23,352 — a small loss after nearly five years. Dollar-cost averaging the same $24,600 across 246 weekly purchases produced $37,703, a 53.3% gain. For Ethereum the contrast is sharper: the lump sum is worth $9,523, a 61% loss, while the weekly schedule is worth $20,800, down 15.4%.
The inverse case is just as real. Starting on 6 January 2020, with Bitcoin at $7,758, the same $34,200 deployed as a lump sum would be worth $282,571 against $77,553 for the weekly schedule. Buying everything at once wins decisively when the entry point turns out to be good.
That is the trade in a sentence: dollar-cost averaging gives up the best outcomes to remove the worst ones. Whether that is a good trade depends entirely on whether you would actually keep buying through a drawdown on the scale our data contains — 83.2% for bitcoin and 94.0% for ether, both measured on 15 December 2018 — which is a question about you rather than about the data.
How much does the schedule matter?
Almost not at all. Deploying roughly $34,200 from 6 January 2020 into Bitcoin three different ways:
| Schedule | Purchases | Average cost | Final multiple |
|---|---|---|---|
| $14.29 daily | 2,393 | $28,395 | 2.257× |
| $100 weekly | 342 | $28,267 | 2.268× |
| $433.33 monthly | 78 | $29,149 | 2.199× |
The spread between the best and worst schedule is about 3% of the final result over six and a half years. Frequency is not where the outcome is decided. Consistency and duration are. If a monthly transfer is more likely to actually happen than a daily one, monthly is the better plan.
What it feels like along the way
Final numbers hide the experience. Two measures of that:
| Start | Asset | Days position was worth less than invested | Purchases below today’s price |
|---|---|---|---|
| 6 Jan 2020 | BTC | 5.2% | 69.6% |
| 6 Jan 2020 | ETH | 1.6% | 42.4% |
| 8 Nov 2021 | BTC | 30.1% | 57.7% |
| 8 Nov 2021 | ETH | 45.6% | 32.1% |
Someone who started Ethereum in November 2021 has spent 45.6% of the entire period looking at a position worth less than they had put into it — years of it, not weeks. That is the part of the strategy that gets abandoned, and no table of final returns captures it. It is worth deciding in advance how you will respond to a multi-year stretch in the red, because you will probably experience one.
The holding-periods tool shows the same measure for single purchases: every day of our history as an entry date, held for one, two or four years.
Splitting between the two assets
A 70/30 split — $70 into Bitcoin and $30 into Ethereum every Monday, the same weighting the Hodlometer Index uses — starting 6 January 2020 turns $34,200 into $73,178, a multiple of 2.14×. That sits between Bitcoin alone at 2.27× and Ethereum alone at 1.84×, which is exactly what a blend should do.
The case for a split is not that it improves returns. Over this period it did not. It is that the two assets have different failure modes, and a holder who is not confident in ranking them may prefer to hold both rather than to be wrong about one. Note that the assets are highly correlated — daily returns have run at 0.86 over the last year — so a split reduces single-asset risk far more than it reduces market risk.
Practical notes
- Fees compound against you. Every figure above assumes zero cost. The gap between venues is larger than most people expect: professional order books charge in the region of 0.1–1.5% per trade, while the one-tap “buy” button in a retail app commonly costs 2–4% once its spread is counted. On a weekly schedule that difference compounds into a real number, and frequency interacts with fees far more than it interacts with price.
- Every purchase is a separate tax lot in most jurisdictions. Weekly buying over five years creates 260 of them. Keep records as you go.
- Automation is the whole point. A schedule you execute manually is a schedule you will skip in exactly the weeks that matter most.
- Decide the end condition in advance. “Buy every week forever” is not a plan. Whether you stop at a target allocation, a target amount, or a date, choosing it before you start is easier than choosing it during a drawdown.
Some holders vary contribution size with market conditions — leaning slightly harder into colder readings of the Hodlometer Index. We have not published a backtest of that approach and do not intend to: with barely more than one complete cycle of data, any such result would be indistinguishable from curve-fitting. Treat it as a scheduling preference, not a strategy with evidence behind it. You can run your own start date, amount and schedule in the DCA calculator.
Frequently asked questions
Does dollar-cost averaging guarantee a profit?
No. It lowers your average cost relative to the average price over the period, but if the price at the end is below your average cost you are down. Two of the eight scenarios in this article are losses.
Is weekly or monthly buying better?
The difference is barely measurable. On identical total contributions from January 2020, daily, weekly and monthly Bitcoin purchases finished at 2.257×, 2.268× and 2.199× respectively. Fees and consistency matter far more than frequency.
What if I had started at the worst possible time?
Starting the week of the November 2021 peak, $24,600 of weekly Bitcoin purchases were worth $37,703 by July 2026, a gain of 53.3%. The same money invested in a single lump on that day was worth $23,352.
Is dollar-cost averaging better than investing a lump sum?
Not in general. From January 2020 a lump sum into Bitcoin finished at 8.26× against 2.27× for weekly buying. Dollar-cost averaging gives up the best outcomes in exchange for removing the worst ones.
How long can a dollar-cost-averaging position stay underwater?
Longer than most people expect. A position started in Ethereum in November 2021 has spent 45.6% of all days since worth less than the amount contributed to it — years, not weeks.
Should I split contributions between Bitcoin and Ethereum?
That depends on circumstances this site cannot know. Mechanically, a 70/30 split from January 2020 returned 2.14× against 2.27× for Bitcoin alone and 1.84× for Ethereum alone, and the two assets’ daily returns have correlated at 0.86 over the last year, so a split reduces single-asset risk much more than market risk.