
Funding Rates, Explained for Holders
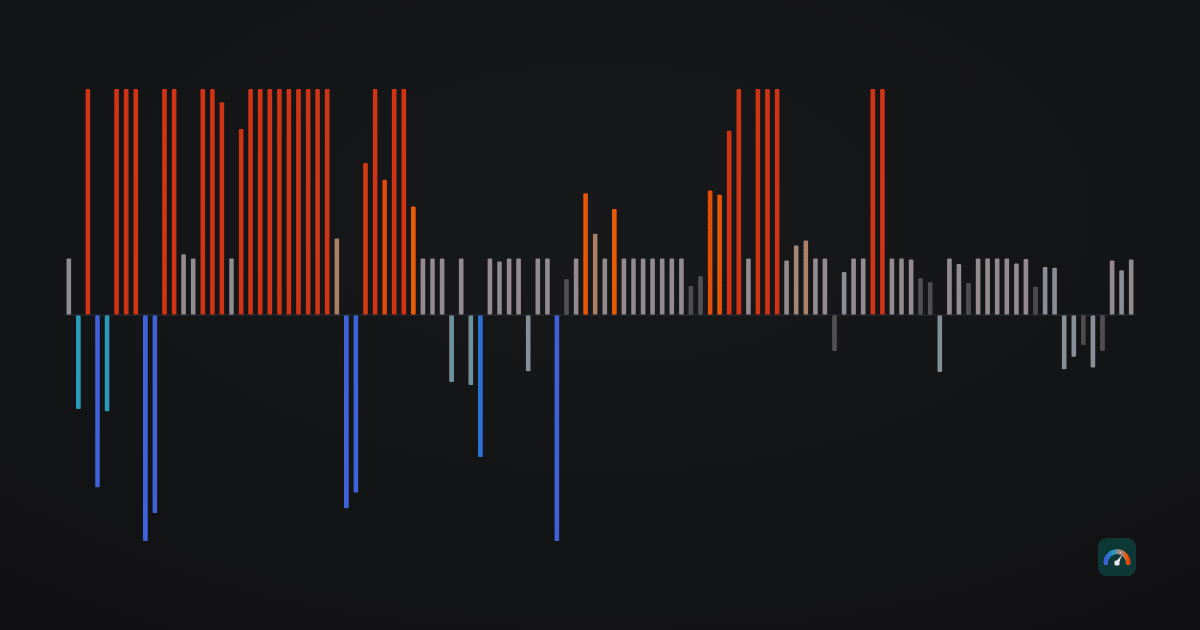
Funding rates belong to the derivatives desk, and most explanations of them are written for people who trade with leverage. If you hold bitcoin and ether in cold storage and never touch a perpetual contract, funding still tells you something worth knowing — not where price is going, but how crowded and how expensive the leveraged side of the market has become.
This is the smallest component of the Hodlometer Index, at 15%, and the one we are most cautious about. Here is what it measures and why we read it as a thermometer rather than a signal. All figures come from our record of Binance USDⓈ-M perpetual funding: 2,511 days for bitcoin from 10 September 2019 and 2,433 days for ether from 27 November 2019, both through the closed candle of 25 July 2026.
What a funding rate is
A perpetual future is a futures contract with no expiry date. That is convenient for traders and a problem for the exchange: with no settlement, nothing forces the contract price back to spot. Funding is the fix — at fixed intervals, holders on one side of the contract pay holders on the other. The payment goes between traders, not to the exchange.
The direction follows the premium. When the perpetual trades above spot — more demand for leveraged longs than shorts — funding is positive and longs pay shorts; below spot it turns negative and shorts pay longs. The payment scales with the drift from spot, so persistently high funding is a direct statement that the long side is crowded and willing to pay to stay there.
Two mechanics matter for reading the numbers. On Binance USDⓈ-M perpetuals the funding interval is eight hours by default, though the exchange uses four hours on some pairs, and the base rate is 0.01% per interval. That base rate is an exchange setting, not a market fact. It is the value funding gravitates to when the contract is trading in line with spot, and it is the reason the series is not centred on zero.
Each figure in our database is the average of the three funding marks published during a UTC day, stored as a rate per eight hours — the convention behind every number below.
0.01% per eight hours, in money
Three intervals a day, 365 days a year, gives 1,095 payments. At the base rate of 0.01% that is 10.95% a year before compounding — the standing cost of a leveraged long position when nothing unusual is happening. A market where the long side pays eleven per cent a year for the privilege is the calm case.
| Funding per 8h | Annualised | Where it sits in our bitcoin history |
|---|---|---|
| −0.01% | −10.95% | Shorts pay longs. Roughly the bottom 2% of days. |
| 0.00% | 0% | Between the 10th and 25th percentile. |
| +0.01% | +10.95% | The exchange base rate. The 75th percentile sits exactly here. |
| +0.03% | +32.9% | Above the 90th percentile. |
| +0.05% | +54.8% | Around the 95th percentile. |
| +0.10% | +109.5% | Around the 99th percentile. |
What the distribution actually looks like
The shape has three features an average hides. A large spike sits at the exchange’s base rate — bitcoin funding was at exactly 0.01% on 23.6% of all days, because when the contract tracks spot the mechanism pins it there. The right tail is fat, and that is where the interesting readings live. And the left region is small but real: funding was negative on 324 days, 12.9% of the history.
| Percentile | Bitcoin (% per 8h) | Annualised | Ether (% per 8h) | Annualised |
|---|---|---|---|---|
| 1st | −0.0133 | −14.6% | −0.0135 | −14.8% |
| 10th | −0.0012 | −1.3% | −0.0007 | −0.7% |
| 25th | +0.0028 | +3.0% | +0.0033 | +3.6% |
| Median | +0.0077 | +8.5% | +0.0082 | +9.0% |
| 75th | +0.0100 | +11.0% | +0.0100 | +11.0% |
| 90th | +0.0245 | +26.8% | +0.0311 | +34.0% |
| 99th | +0.1011 | +110.7% | +0.1246 | +136.4% |
| Highest day | +0.1706 (12 Feb 2020) | +186.9% | +0.2669 (12 Feb 2020) | +292.2% |
| Lowest day | −0.1272 (13 Mar 2020) | −139.2% | −0.1764 (15 Sep 2022) | −193.2% |
The medians are almost identical, at roughly 8.5–9% a year; the tails are not. Ether’s 90th and 99th percentiles are each about a quarter above bitcoin’s — leverage on ether is more enthusiastic and more expensive when it gets going. Its most negative day, −0.176% on 15 September 2022, coincides with the date of Ethereum’s move to proof of stake (external, not verified against our data). The two series track each other closely: correlation 0.87 over 2,433 overlapping days.
Annual averages track the cycle you would expect for bitcoin: +17.2% annualised in 2020, +30.6% through 2021, then +4.2% in 2022, +11.9% in 2024 and +1.8% so far in 2026.
A thermometer of positioning, not a signal
The temptation with a series like this is obvious: crowded longs get liquidated, therefore high funding means sell. To check it, we pulled the hottest and coldest seven-day funding windows in our bitcoin history — taking only windows at least 45 days apart, so a single episode cannot fill the table — and looked at what price did next.
| Window ends | 7-day funding | Annualised | BTC close | +30 d | +90 d | +180 d |
|---|---|---|---|---|---|---|
| 15 Feb 2020 | +0.0916% | +100% | $9,905 | −49% | −6% | +19% |
| 2 Aug 2020 | +0.0663% | +73% | $11,071 | +8% | +25% | +209% |
| 25 Nov 2020 | +0.0567% | +62% | $18,719 | +32% | +161% | +107% |
| 14 Feb 2021 | +0.1281% | +140% | $48,578 | +17% | −4% | −2% |
| 16 Apr 2021 | +0.0992% | +109% | $61,335 | −24% | −48% | −6% |
| 10 Nov 2021 | +0.0420% | +46% | $64,882 | −27% | −32% | −54% |
| 2 Jan 2024 | +0.0388% | +42% | $44,947 | −4% | +55% | +40% |
| 6 Mar 2024 | +0.0549% | +60% | $66,074 | +3% | +7% | −11% |
Thirty days after those eight windows the price sat anywhere between −49% and +32%. That spread is the finding. Inside it, four ended lower and four higher — which is to say the direction was a coin toss and the size was not. Ninety days out, the same. Whatever crowded leverage tells you, it is not the direction of the next month.
| Window ends | 7-day funding | Annualised | BTC close | +30 d | +90 d | +180 d |
|---|---|---|---|---|---|---|
| 8 Oct 2019 | −0.0068% | −7% | $8,168 | +13% | −5% | −17% |
| 27 Nov 2019 | −0.0071% | −8% | $7,509 | −3% | +24% | +19% |
| 19 Mar 2020 | −0.0479% | −52% | $6,162 | +18% | +54% | +75% |
| 4 Nov 2020 | −0.0077% | −8% | $14,144 | +32% | +151% | +304% |
| 26 Jul 2021 | −0.0139% | −15% | $37,238 | +32% | +63% | −6% |
| 15 Nov 2022 | −0.0172% | −19% | $16,901 | +3% | +29% | +59% |
| 12 Feb 2026 | −0.0049% | −5% | $66,185 | +8% | +20% | — |
| 21 Apr 2026 | −0.0054% | −6% | $76,350 | +2% | −15% | — |
The cold side spans −3% to +32% after thirty days, and seven of the eight ended higher — and we would ask you not to trust it. Eight episodes is not a sample. Deeply negative funding is produced by forced selling, so this is close to asking whether price is higher a month after a capitulation low: a question that answers itself in hindsight and never in advance. And four of the eight sit inside one bull cycle, which is where the +151% and +304% figures come from.
Where it sits today
For the closed candle of 25 July 2026 the trailing seven-day average was +0.0046% per 8h for bitcoin, about +5.0% annualised, and +0.0021% for ether, about +2.3%. Both sit below their own medians and well below the exchange base rate: the leveraged long side is neither crowded nor paying much to be there.
The current seven-day figure, with its percentile against the last four years, updates daily on the markets page.
Inside the Hodlometer Index this ranks as a percentile score of 35.2 out of 100, the warmest of the four components. That is worth noticing: leverage is subdued, but not as unusually subdued as the price-based measures. The clearer signal of the year is on the negative side — 2026 has produced 66 negative funding days in 206, 32% of them, the highest rate of any year in our record and close to four times the 2025 rate of 8%.
Limitations worth knowing
- It is one exchange. We use Binance USDⓈ-M perpetuals. Other venues set different base rates, intervals and clamps, so a funding chart elsewhere will not match ours.
- The baseline is a setting, not a market. The 0.01% base rate and the eight-hour interval are exchange parameters. If Binance changed them, this component would shift without anything happening in the market.
- The history is the shortest we hold. Perpetual funding data begins in late 2019. There is no funding series for 2017 or 2018 at all, which is one reason it carries only 15% weight.
- Daily averaging hides intraday spikes. A violent print inside a day is smoothed into the daily figure — right for a holder’s horizon, wrong for a trader’s.
- It says nothing about size. Funding is a price, not a quantity. A high rate on a small book and a high rate on a large one look identical here; open interest is the missing half of that picture.
How a holder can use it
Treat it as a running measurement of how much of the market’s enthusiasm is rented. When funding sits near or below its base rate for months, whatever is happening to price is happening mostly with spot money. When it runs at 50% or 100% annualised, a meaningful share of the bid is borrowed and carries a daily cost, which makes a sharp move down more violent than the news behind it would suggest.
Neither state tells you what to do; both change how you read the other numbers on your dashboard. A rally on flat funding and the same rally on 100% funding are the same chart and different markets, and knowing which one you are in is worth more than any threshold rule this series could support.
The full weighting scheme, the percentile method and the funding caveats are on the methodology page. For the components that carry more weight, see the pieces on the Mayer Multiple, the 200-week moving average and the Fear & Greed Index.
Frequently asked questions
What is a funding rate in crypto?
A periodic payment between holders of a perpetual futures contract that keeps its price tethered to spot. When the perpetual trades above spot, longs pay shorts; when it trades below, shorts pay longs. The payment goes between traders, not to the exchange.
What does 0.01% funding per 8 hours cost per year?
About 10.95% before compounding: 0.01% × 3 intervals a day × 365 days. That is Binance’s base rate on USDⓈ-M perpetuals — the calm case, not an extreme one.
What is a normal funding rate for Bitcoin?
In our record of 2,511 days since September 2019 the median is +0.0077% per 8h, about +8.5% a year. The 25th percentile is +0.0028% and the 75th sits exactly on the 0.01% base rate. Funding was at exactly the base rate on 23.6% of all days.
Can funding rates go negative?
Yes, when the perpetual trades below spot and shorts pay longs. It happened on 324 of 2,511 bitcoin days, 12.9% of the history. The most negative bitcoin day was −0.127% per 8h on 13 March 2020.
Does high funding mean the price is about to fall?
Our data does not support that. Across the eight hottest seven-day funding windows in the bitcoin record, the price thirty days later ranged from −49% to +32%. Inside that spread, four ended lower and four higher. Funding measures how crowded and expensive leveraged positioning is, not direction.
Why does funding carry only 15% of the Hodlometer Index?
It is the noisiest input, the shortest history — perpetual data starts in late 2019 — and it depends on exchange settings rather than on the market alone. It earns a place as an early warning that leverage is building, and not more than that.