Bitcoin Halving Cycles, Compared
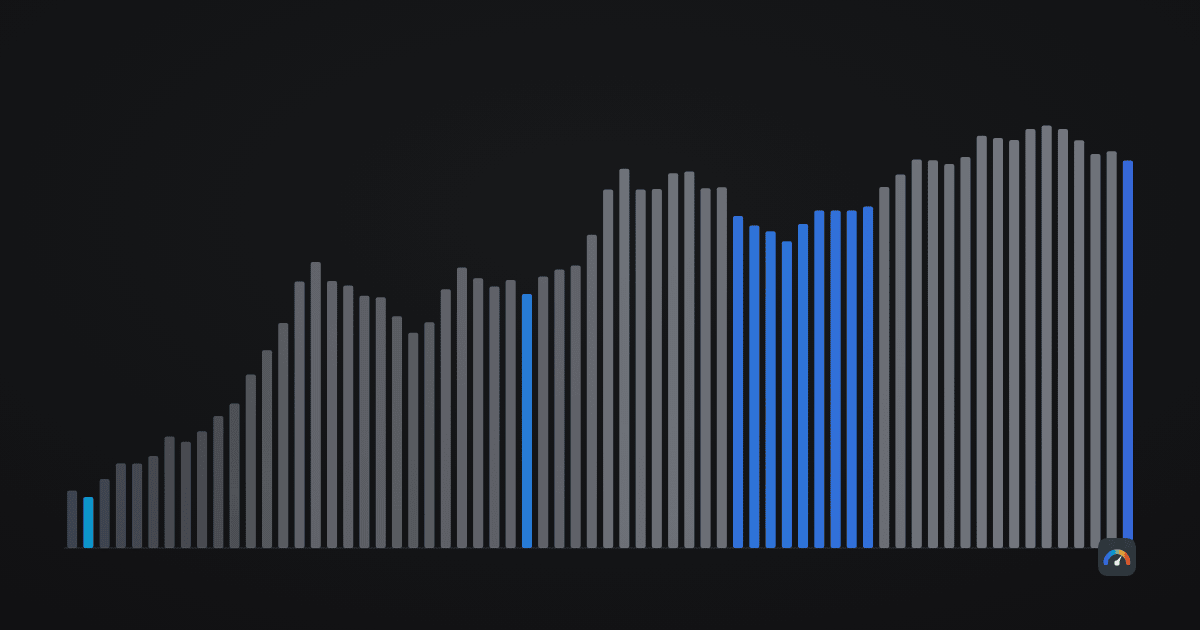
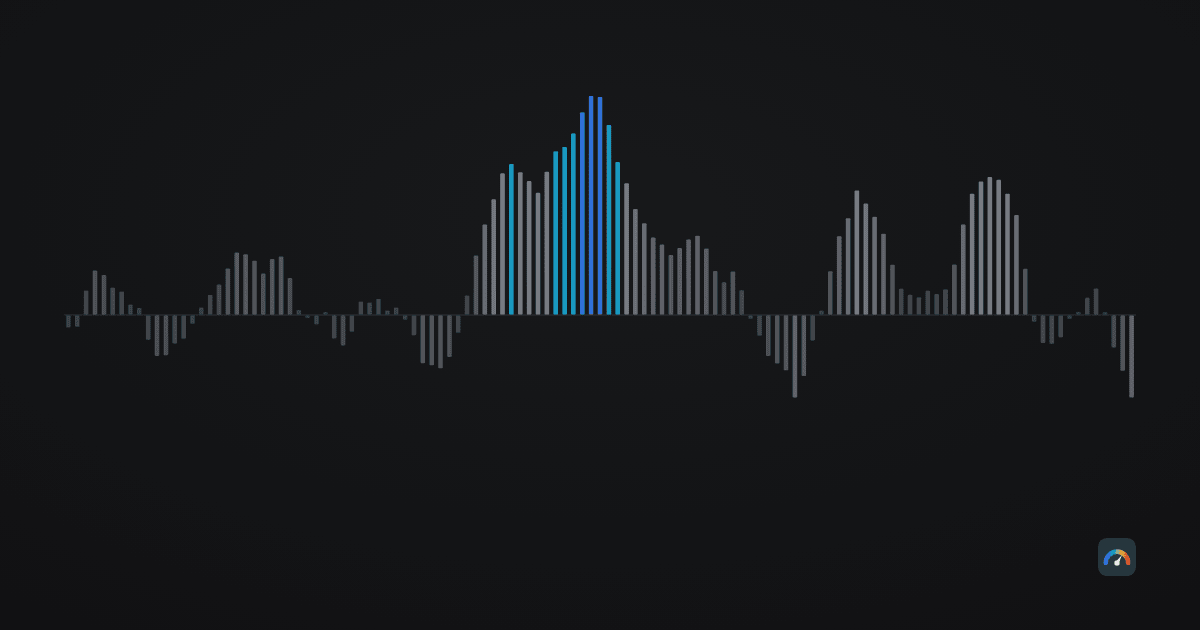
Two halvings, 1,440 days apart, normalised to their own dates: where the 2020 and 2024 cycles agree, and where they differ by a factor of four.
How the classic cycle indicators work, and what they actually tell a long-term holder.
Two halvings, 1,440 days apart, normalised to their own dates: where the 2020 and 2024 cycles agree, and where they differ by a factor of four.
What perpetual funding is, what 0.01% per eight hours costs over a year, and what seven years of our own data say about the extremes.
What the alternative.me index is actually built from, why it covers bitcoin only, and how often extreme fear and extreme greed have really occurred.
Price divided by its 200-day average. What eight years of data say about the distribution, the 2.4 threshold, and why we rank it as a percentile.
The average weekly close over four years. How often price falls below it, why Bitcoin's baseline behaves differently from Ethereum's, and today's reading.