Bitcoin Implied Volatility: How to Read DVOL
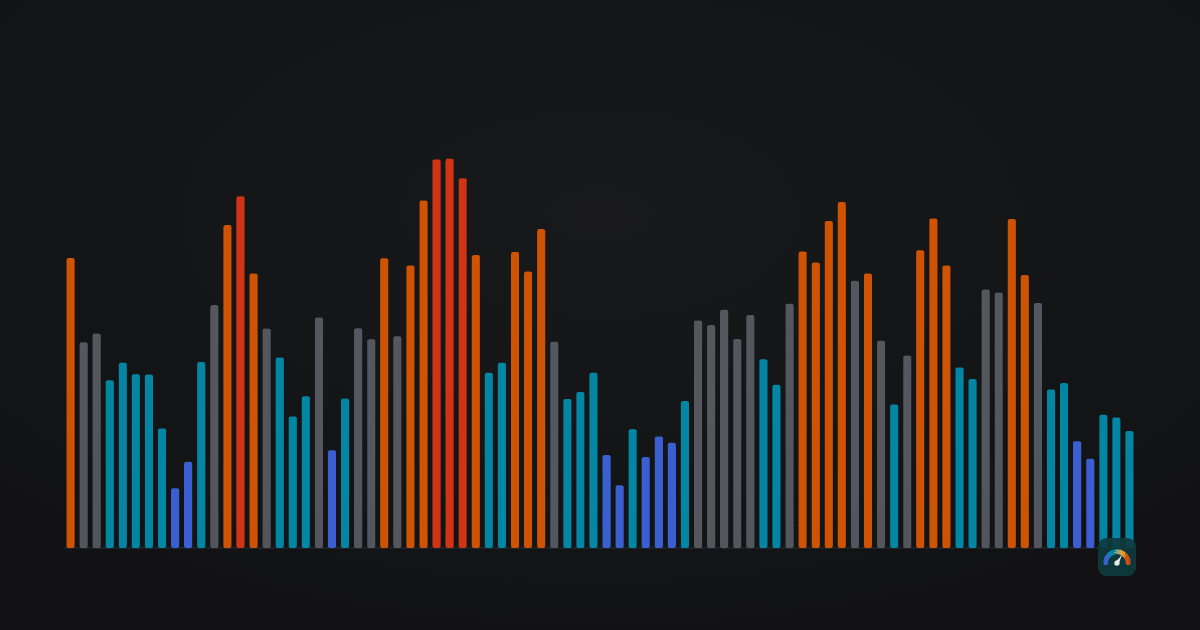
What Deribit's DVOL index measures, how a year of implied volatility compared with what bitcoin then did, and why ether's reading never came down to bitcoin's.
What Deribit's DVOL index measures, how a year of implied volatility compared with what bitcoin then did, and why ether's reading never came down to bitcoin's.
A single 0–100 reading of how hot the BTC and ETH market is versus its own last four years: four components, five zones, and where the index is weak.
Price divided by its 200-day average. What eight years of data say about the distribution, the 2.4 threshold, and why we rank it as a percentile.
The average weekly close over four years. How often price falls below it, why Bitcoin's baseline behaves differently from Ethereum's, and today's reading.