
Bitcoin Implied Volatility: How to Read DVOL
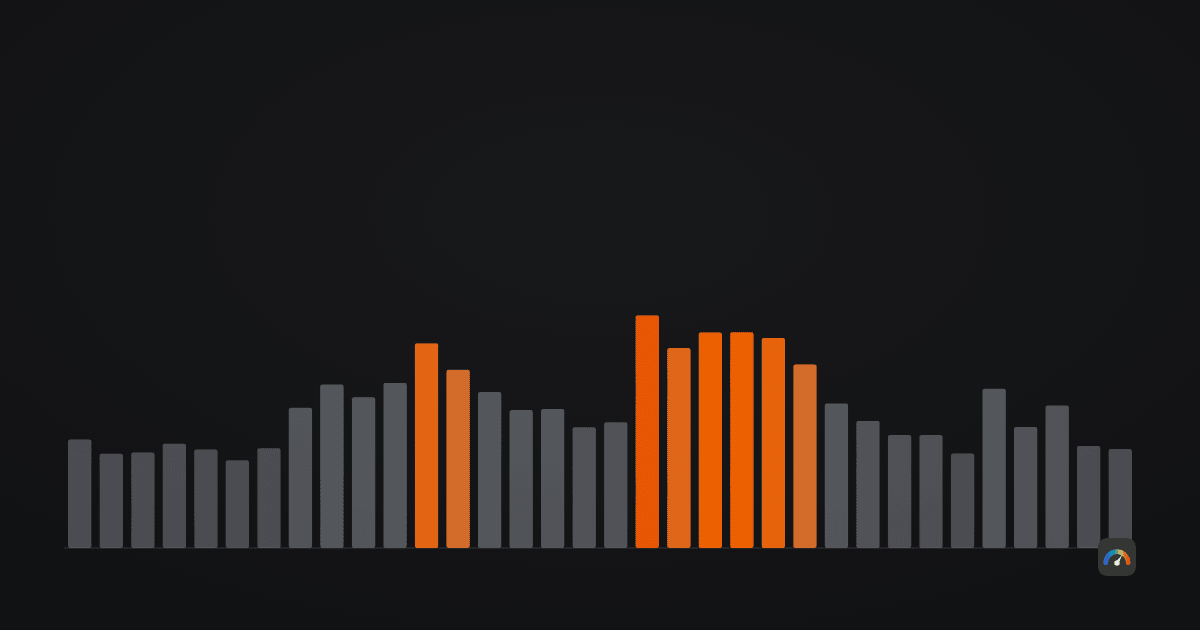
Almost every number on this site looks backwards: the Mayer Multiple, the 200-week average, drawdowns, funding history. Implied volatility is the exception. It is the one number in our database that encodes an expectation about the future — specifically, how violently the options market believes bitcoin will move over the next thirty days. That makes it worth understanding even if you never intend to touch an option, and it makes it easy to misread in a particular way this article will try to prevent.
What follows is a description of the measure and of one year of our own data, not advice about anything. Every figure is computed from daily DVOL closes we collect from Deribit — 370 prints from 22 July 2025 to 26 July 2026 for each asset — and from our own daily price closes (bitcoin from Bitstamp since August 2011, ether from Bitfinex since March 2016; see our methodology).
What DVOL actually measures
DVOL is a volatility index published by Deribit, the venue where most crypto options volume trades. It is built from the prices of those options, and it answers one question: what annualised volatility over the next thirty days would justify what people are currently paying for protection and leverage? A DVOL of 40 means the options market is pricing bitcoin to move at a 40%-a-year pace. That expectation is specifically about the next thirty days — DVOL always prices one month ahead, just quoted in yearly terms.
Two properties follow from that construction. First, it is a market price, not a model output — when DVOL rises, someone is actually paying more for options. Second, it is an expectation, and expectations can be wrong in both directions. The gap between what was implied and what then happened is itself a measurable quantity, and we measure it below.
The commonly quoted comparison is the VIX, which does the same job for the S&P 500. The VIX has spent most of its life between 10 and 20. Bitcoin’s DVOL spent the last year between 34 and 83. The asset class is not calmer than equities on any horizon we can measure.
Turning the number into something readable
An annualised percentage is an awkward unit for a thirty-day expectation. The useful conversion is to divide by the square root of 365 — volatility grows with the square root of elapsed time, not with time itself, and crypto trades every calendar day where equities annualise over 252 trading days. That turns DVOL into the typical daily move the market is pricing:
| DVOL reading | Implied typical daily move | Context from our year of data |
|---|---|---|
| 35 | ±1.8% | Near the calmest bitcoin print of the year (33.8) |
| 42 | ±2.2% | Bitcoin’s median for the year |
| 52 | ±2.7% | Ether’s reading on 26 July 2026 |
| 67 | ±3.5% | Ether’s median for the year |
| 83 | ±4.3% | Bitcoin’s peak, printed 5 February 2026 |
| 96 | ±5.0% | Ether’s peak, same day |
Read this way, the index becomes a plain sentence. A bitcoin DVOL of 37 says: the market expects days of about ±2%, with regular excursions beyond that. It says nothing about direction — implied volatility is a price of motion, not of destination.
One year of DVOL on our data
Our DVOL series is exactly one year deep — Deribit serves a year of daily candles per request, and we began storing them in July 2025. That is long enough to describe a range and far too short for the percentile treatment we give our index components, which is one reason DVOL is not part of the Hodlometer Index. Here is the year in five numbers per asset:
| Measure | Bitcoin DVOL | Ether DVOL |
|---|---|---|
| Reading on 26 July 2026 | 37.3 | 51.7 |
| Median of the year | 42.4 | 67.0 |
| Lowest print | 33.8 (18 Sep 2025) | 47.7 (25 May 2026) |
| Highest print | 82.6 (5 Feb 2026) | 95.8 (5 Feb 2026) |
| Days above 50 | 69 of 370 | 354 of 370 |
The February spike is the year’s defining event. Bitcoin’s daily close fell from $95,593 on 15 January 2026 to $62,778 on 5 February — roughly a third in three weeks — and DVOL peaked at 82.6 on the exact day of that local low. Both assets printed their volatility high on the same date, which is typical: implied volatility spikes are a property of the market, not of one asset.
As of 26 July 2026, bitcoin’s 37.3 sits at the 20th percentile of its own one-year range and ether’s 51.7 at the 8th. The options market currently prices both assets nearer the calm end of the only year we can rank them against — with the caveat that a one-year ranking window is thin evidence by this site’s usual standards.
Implied against realized: was the fear priced right?
Implied volatility is a forecast, and forecasts can be scored. For every DVOL print in our series we computed the realized volatility of the following thirty days and subtracted it from what the options market had implied. A positive number means options were priced for more turbulence than arrived; a negative number means the market under-priced what came.
| Measure, implied minus subsequent realized | Bitcoin | Ether |
|---|---|---|
| Median gap | +5.6 points | +6.5 points |
| Mean gap | +2.4 points | +1.7 points |
| Days implied was higher | 230 of 340 (67.6%) | 203 of 340 (59.7%) |
| Worst under-pricing | −44.5 points | −52.9 points |
The pattern matches what option markets do in most asset classes: on a typical day, implied runs a few points above what then happens. Sellers of options demand a premium for carrying the risk of the atypical day, and in our year they usually collected it — two days out of three for bitcoin.
The mean being far below the median is the honest part of the table. When the under-pricing came, it came violently: a holder of the January 2026 prints watched a market that had implied roughly 40-point volatility deliver an 83% realized month. The premium is collected in small instalments and repaid in one large one — that asymmetry, not the median, is why buying protection permanently is expensive and selling it permanently is dangerous. Neither observation is a strategy; both are properties of one year of data.
What implied volatility did not see coming
It is tempting to treat an options-derived number as the market’s advance warning system. Our year of data offers two clean counterexamples.
The lowest bitcoin DVOL of the entire year — 33.8 on 18 September 2025, with bitcoin at $117,169 — arrived eighteen days before the all-time-high close of $124,740 on 6 October. On the day of the top itself DVOL printed a sleepy 39.3. The options market was at its calmest at precisely the moment the largest drawdown of the year was about to begin.
And the highest print of the year, 82.6, did not precede the February low — it landed on it, 5 February 2026. Implied volatility rose with the crash, not ahead of it. In both directions the index was a coincident gauge of stress, not a leading one. That is not a flaw; it is what a price of insurance does. Insurance is cheapest when nobody has recently needed it.
The ether gap
Ether’s DVOL closed above bitcoin’s on all 370 days of our series. The average gap was 21.5 points; the narrowest it ever got was 12.0. As a ratio, ether’s implied volatility averaged roughly 1.5 times bitcoin’s.
The options market is not inventing that spread. Over the year to 26 July 2026, ether’s realized volatility was 66.4% against bitcoin’s 43.1%, a ratio of about 1.5 — and the same ordering holds across every complete calendar year we have held both assets, 2017 through 2025, as the BTC-versus-ETH comparison documents. Implied simply agrees with realized here: whatever the market regime, ether has moved more, and options on it are priced accordingly. A holder of both assets should expect the ether side of the portfolio to supply most of the surprises, in both directions.
The longer arc: volatility is drifting down
Our implied series is a year deep, but realized volatility can be computed across the whole price history. By calendar year, annualised from daily log returns:
| Year | Bitcoin realized vol | Ether realized vol |
|---|---|---|
| 2013 | 150% | — |
| 2015 | 71% | — |
| 2017 | 96% | 134% |
| 2019 | 68% | 81% |
| 2021 | 81% | 109% |
| 2023 | 44% | 47% |
| 2025 | 42% | 75% |
| 2026 (to 26 Jul) | 47% | 64% |
Bitcoin in 2013 moved at 150% a year, with a thirty-day stretch ending in early May of that year that annualised to 361% — the wildest thirty days in our whole series. The 2023–2026 stretch has run at 42–53%. The direction of travel is unmistakable even if the mechanism (deeper markets, ETF flows, a larger holder base) is partly guesswork, and even though the February 2026 crash showed the old regime is still available on demand: the trailing 30-day realized figure touched 83.4% on 4 March 2026. A DVOL median in the low 40s would have looked implausibly quiet to anyone watching bitcoin a decade ago. Quieter days are not smaller drawdowns, though: the present decline is already the seventh-deepest in our fifteen-year record while daily volatility sits near its historic lows. So far the two have moved independently.
Limitations worth knowing
- One year of history. Deribit’s public endpoint serves a year of daily candles, and that is what we hold. Every percentile and every average above describes twelve months containing exactly one crash. We do not rank DVOL against a four-year window the way we rank index components, because we cannot.
- It is one venue’s index. DVOL is computed from Deribit’s order book. Deribit is where most crypto options liquidity lives, but a venue-specific measure inherits venue-specific distortions.
- Thirty days is the only horizon. DVOL prices the next month. A holder’s horizon is years. The number is context about the near term, not about the thing a holder actually owns.
- We use it narrowly. On this site DVOL feeds the data block our forecast models read — it is the only forward-looking input they get. It does not enter the Hodlometer Index and we do not publish a DVOL dashboard; the index itself is Deribit’s product, not ours.
How a holder can use it
Mostly as a unit converter between headlines and expectations. If DVOL reads 40, a 2% day is not news — it is the market functioning as priced. Checking the number once a week recalibrates what “a big move” currently means, which is genuinely useful when your feed is shouting about every red candle.
It also pairs naturally with the Fear & Greed Index. Both try to measure stress; one polls behaviour and price action, the other reads what people pay for insurance. When both sit low while price grinds upward — as in September 2025 — that is a market pricing serenity, and our year of data shows how much warning that gives: none. What implied volatility offers a long-horizon holder is not foresight but honesty about the present — a live, dollar-weighted measurement of how rough the ride is currently expected to be. Position sizing against that number, rather than against last month’s memory of calm, is the entire practical lesson, and it is a lesson about risk, not about return.
Frequently asked questions
What is DVOL?
DVOL is Deribit’s volatility index: the annualised volatility over the next 30 days implied by the prices of bitcoin (or ether) options trading on that venue. A DVOL of 40 means options are priced as if the asset will move at a 40%-per-year pace over the coming month.
How do I convert DVOL into an expected daily move?
Divide by the square root of 365 (about 19.1). A DVOL of 42 implies typical daily moves of about ±2.2%; the February 2026 peak of 82.6 implied about ±4.3% per day. Roughly one day in three is expected to exceed the figure.
Is implied volatility a leading indicator for bitcoin’s price?
Not in the one crash we have observed. The year’s lowest bitcoin DVOL (33.8) printed eighteen days before the all-time high of 6 October 2025, and the year’s highest (82.6) printed on the day of the February 2026 low, not before it. It moved with stress, not ahead of it — one episode, not a track record.
Why is ether’s DVOL always higher than bitcoin’s?
Because ether moves more. Across our year of DVOL data ether’s implied volatility exceeded bitcoin’s on all 370 days, averaging 21.5 points more — and realized volatility shows the same ratio (66.4% vs 43.1% over the year to 26 July 2026). The options market is pricing a real difference, not a sentiment quirk.
Does implied volatility overstate what actually happens?
Usually, mildly. Comparing each DVOL print with the realized volatility of its following 30 days, implied came in higher on 67.6% of days for bitcoin, with a median gap of about 6 points — though those daily windows overlap heavily, so they amount to a dozen-odd independent stretches, not 340. But the exceptions were large: around the February 2026 crash, realized exceeded implied by up to 44 points.
Is DVOL part of the Hodlometer Index?
No. Our DVOL history is only one year deep, which is far too short for the four-year percentile treatment the index applies to its components. We store DVOL daily and feed it to our forecast models as their only forward-looking input.