Bitcoin Drawdown History: Every Major Decline Since 2011
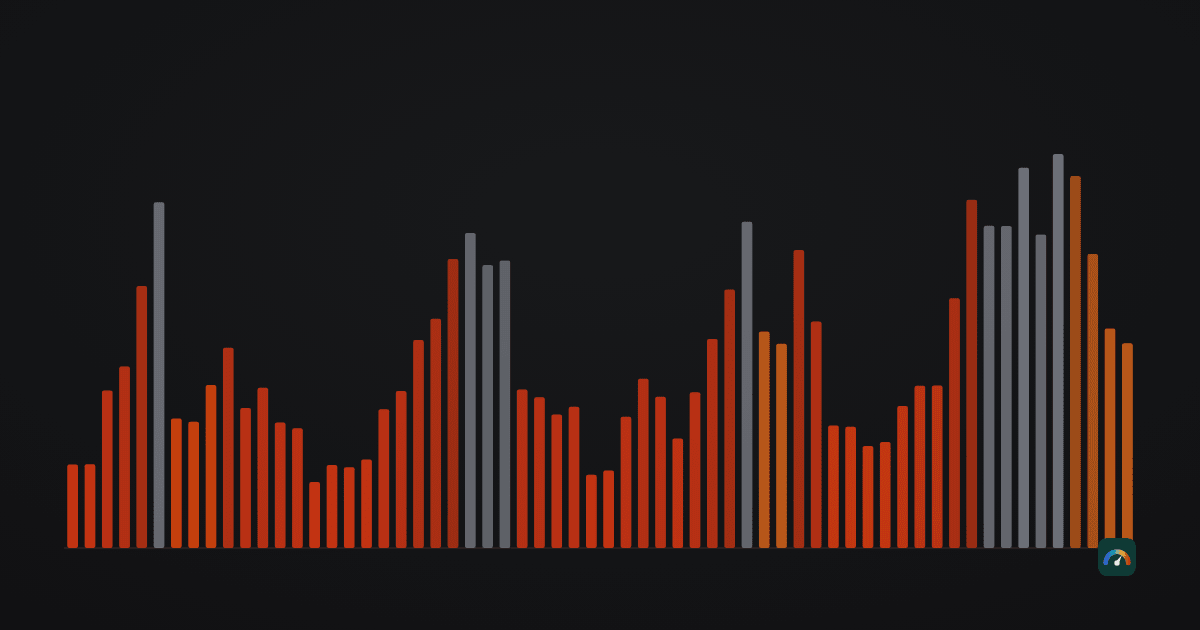
Seven declines of 50% or more in fifteen years of daily closes: how deep each went, how long recovery took, and why the median day sat 46% below the peak.
Seven declines of 50% or more in fifteen years of daily closes: how deep each went, how long recovery took, and why the median day sat 46% below the peak.
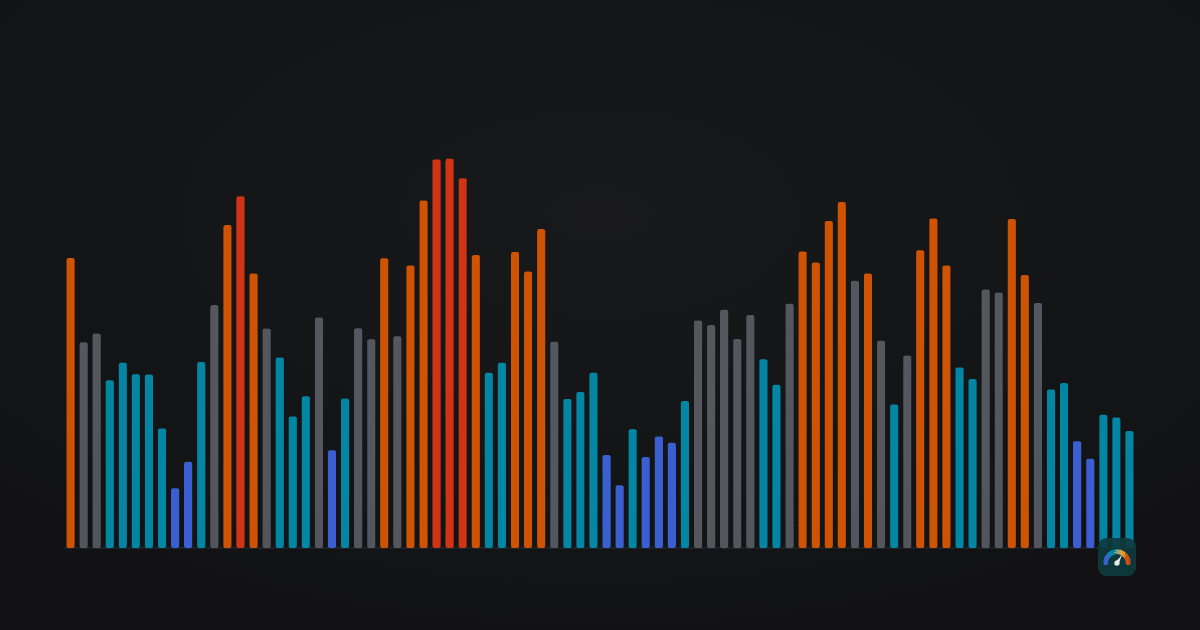
A single 0–100 reading of how hot the BTC and ETH market is versus its own last four years: four components, five zones, and where the index is weak.
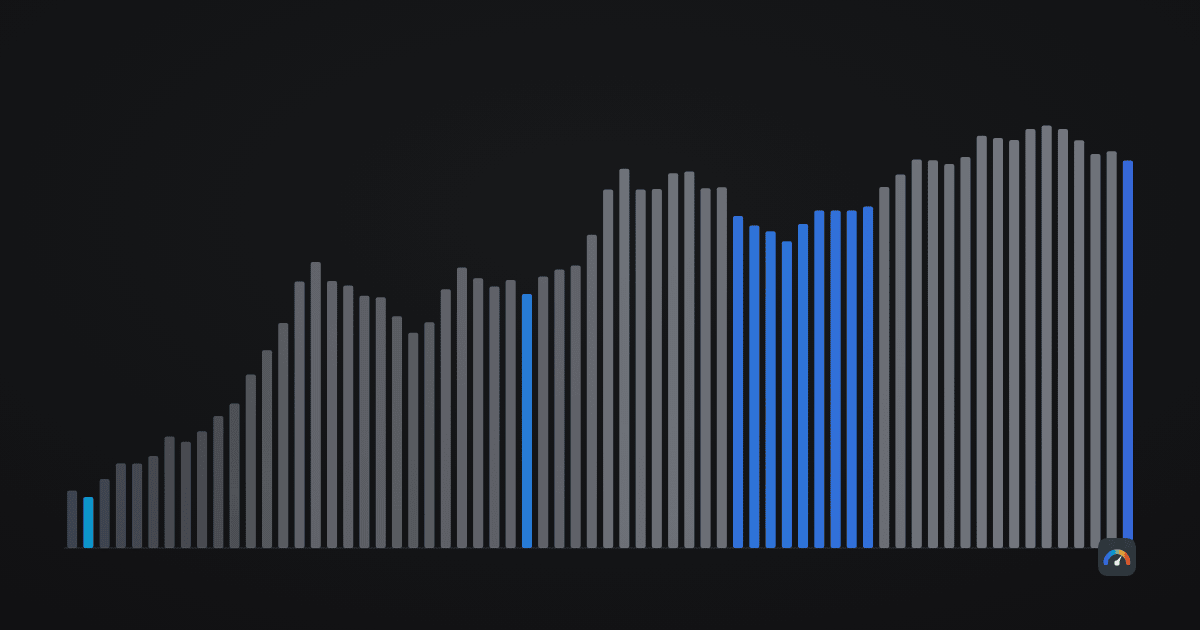
The average weekly close over four years. How often price falls below it, why Bitcoin's baseline behaves differently from Ethereum's, and today's reading.