
Bitcoin Drawdown History: Every Major Decline Since 2011
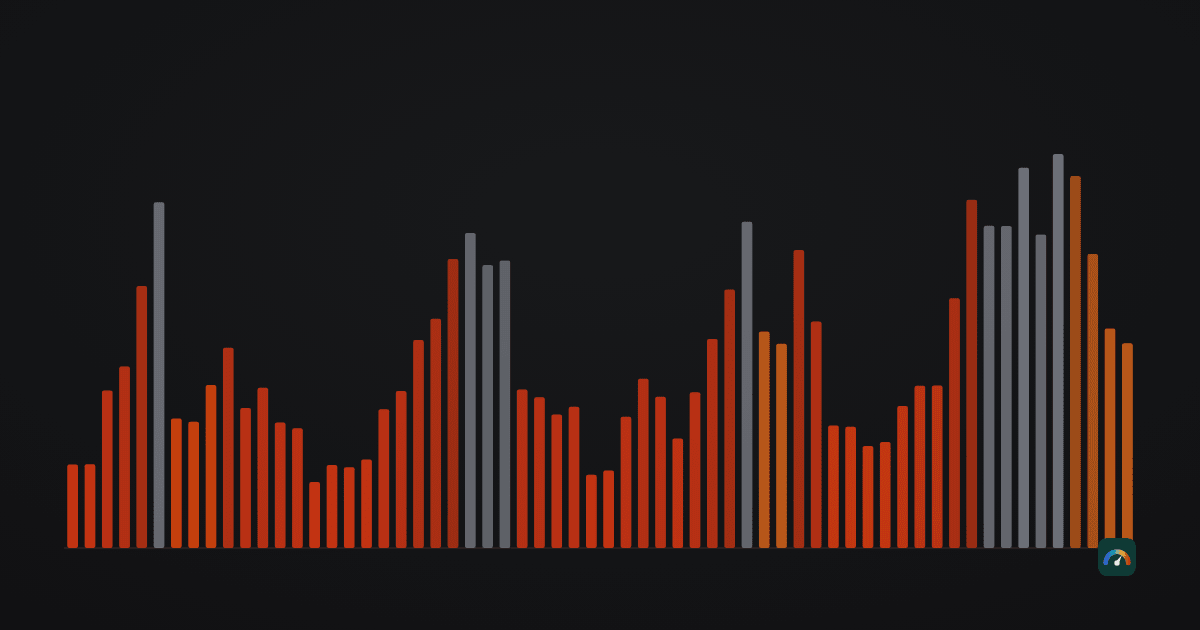
Across the 5,457 daily closes in our bitcoin series, the median day sat 46.3% below the highest close that had come before it. Not the worst day — the median one. Owning bitcoin has mostly meant being a long way under the peak, and the days everyone remembers, the ones at fresh highs, account for 4.3% of the total.
This article is a census of every major drawdown in that series — how deep each one went, how long the fall took, and how long the climb back required. It is history, not advice: fifteen years is a small sample containing a handful of genuinely independent events. All figures are computed from our own daily UTC closes — bitcoin from Bitstamp, ether from Bitfinex, the same series that feeds every tool on this site (see our methodology) — 18 August 2011 to 26 July 2026.
How we measure
A drawdown here is the distance between a daily close and the highest daily close before it. An episode begins the day price slips below its running all-time high and ends the day a new high is set. Three consequences of that definition are worth stating plainly:
- Intraday extremes are invisible. We store one close per day. Every depth below is therefore kinder than what someone watching live prices experienced, by an amount daily data cannot measure.
- The series starts where our data starts. Bitcoin’s first boom and bust in mid-2011 mostly predates the 18 August 2011 start of our closes, so the first episode below is entered in progress. Earlier prices exist on other people’s charts; we do not publish numbers we cannot verify.
- “Recovery” means a new high, not breaking even. An individual buyer’s break-even depends on their entry. The holding-periods tool looks at exactly that question from every possible start date.
The seven declines of 50% or more
By this measure bitcoin has fallen below its prior peak in 88 separate episodes since August 2011. Most were shallow and brief. Ten reached 30%; these seven reached half:
| Peak | Trough | Depth | Fall took | New high after |
|---|---|---|---|---|
| 20 Aug 2011 · $11.70 | 20 Oct 2011 · $2.24 | −80.9% | 61 days | 298 days |
| 9 Apr 2013 · $229 | 6 Jul 2013 · $66 | −71.0% | 88 days | 122 days |
| 4 Dec 2013 · $1,132 | 14 Jan 2015 · $171 | −84.9% | 406 days | 771 days |
| 16 Dec 2017 · $19,103 | 15 Dec 2018 · $3,212 | −83.2% | 364 days | 710 days |
| 13 Apr 2021 · $63,575 | 20 Jul 2021 · $29,790 | −53.1% | 98 days | 91 days |
| 8 Nov 2021 · $67,526 | 21 Nov 2022 · $15,781 | −76.6% | 378 days | 469 days |
| 6 Oct 2025 · $124,740 | 30 Jun 2026 · $58,566 * | −53.0% * | 267 days * | ongoing, 293 days so far |
Below the 50% line sit the forgotten ones: a 39.9% drop over three days in August 2012, and two separate ~35% declines inside 2017 — June to July, then a two-week 34% slide in September — a year remembered as an uninterrupted melt-up. Even bitcoin’s best years contained falls that would count as a crisis in most portfolios.
Falls are fast; recoveries are not
In all five episodes deeper than 70%, the climb back to the old peak took longer than the fall — between 1.2 and 4.9 times as long. The 2018 bear is typical: 364 days from peak to trough, then 710 days from trough back to the peak’s level. Measured peak to new peak, the four deepest drawdowns consumed 359, 847, 1,074 and 1,177 days — one to three-plus years each, and together nearly two-thirds of bitcoin’s entire trading history.
The one counterexample is instructive: mid-2021, the only 50%+ decline that healed faster than it formed (98 days down, 91 back). It is also the only one that did not follow a multi-year advance. Deep drawdowns that terminate a full cycle have always, in this small sample, taken years to repair.
By that criterion the current episode belongs with the slow group: it followed more than two years of advance into the October 2025 high, not a three-month spike. That is a pattern match on five prior events, not a forecast — but it is the honest place to file it.
Time under water
Summed across all 5,457 days:
| Condition on the day’s close | Days | Share of history |
|---|---|---|
| At a new all-time high | 235 | 4.3% |
| 10% or more below the peak | 4,518 | 82.8% |
| 20% or more below | 4,037 | 74.0% |
| 30% or more below | 3,666 | 67.2% |
| 50% or more below | 2,379 | 43.6% |
| 70% or more below | 719 | 13.2% |
| 80% or more below | 115 | 2.1% |
The table rewards a slow read. A fifth-of-the-time event in most markets would be a correction; for bitcoin, being 50% under the peak has been closer to a coin flip than an emergency — 43.6% of all days. The longest stretch without a new high ran 1,177 days, from December 2013 to February 2017: over three years in which the only thing a holder accumulated was patience.
What the table cannot show is that these states are not evenly sprinkled through time — they arrive in blocks lasting years, which is precisely what makes them hard to hold through. A 46% median drawdown as a statistic is painless; the third year of one is not. The word capitulation exists because enough people eventually discover the difference — the point in a long drawdown where holders sell not because the thesis changed, but because the wait did.
The current episode
As of 26 July 2026, bitcoin’s last close of $65,330 sits 47.6% below the all-time-high close of $124,740 set on 6 October 2025 — 293 days ago. The deepest close so far came on 30 June 2026 at $58,566, 53.0% under the peak, which makes this the seventh-deepest episode in our series and, by our measure, already a member of the 50% club.
Where it goes from here is not something a table of history can say. What the table can supply is scale: four past episodes went materially deeper (76–85%), and three of those four took at least a further year from trough to new high — the exception being the 2011 crash, whose peak our data barely captures. The live reading is on the markets page, and the 200-week moving average — currently the slow context line beneath price — is the companion measure we keep for exactly these stretches.
Ether, for contrast
Everything above is bitcoin. Ether’s version of the same census, from its March 2016 data start, is harsher in every column. Its median day sat 52.2% below the prior peak; more than half of all its days — 52.6% — were 50% or more under water. Its deepest episode, January to December 2018, reached −94.0%, and its longest wait between highs ran 1,383 days, from November 2021 to August 2025. That new high lasted precisely one close before the next decline began: as of 26 July 2026 ether sits 59.6% below its 22 August 2025 peak of $4,829.
A holder of both assets should read the two records as different contracts. Bitcoin’s history says: expect to lose half, occasionally more, and wait years. Ether’s says the same with deeper troughs and longer waits — the full side-by-side is in our BTC-versus-ETH comparison.
What a holder does with this
Three uses, none of them predictions:
- Size positions against the record, not the average year. The historical contract has included −80% or worse three times and −76% once. An allocation that only survives a 30% fall is, by this data, sized for a market bitcoin has not yet been.
- Write the plan before the episode. Every past drawdown eventually offered a day down 50% from the peak. Whether you would buy, hold or need to sell on that day is best decided while it is hypothetical — our DCA guide covers what mechanical buying through the 2021–2022 episode actually produced.
- Judge duration, not just depth. The falls take months; the round trips take years. The holding-period statistics turn that into a number per horizon: how often one, two and four years of waiting ended above water.
The census will need a new row someday, in whichever direction. What it will not need is a revision to its central fact: on the median day of its history so far, bitcoin traded at barely half its former peak — and everyone who held it through those days did so on purpose.
Frequently asked questions
What is bitcoin’s biggest drawdown ever?
In our daily-close series (from 18 August 2011): −84.9%, from $1,132 on 4 December 2013 to $171 on 14 January 2015. The 2018 bear came close at −83.2%. Intraday prices went lower still, and bitcoin’s mid-2011 crash mostly predates our data.
How often is bitcoin in a drawdown?
Almost always. Only 4.3% of the 5,457 daily closes in our series set a new all-time high, 74% of days sat 20% or more below the prior peak, and 43.6% sat 50% or more below. The median day was 46.3% under the peak.
How long do bitcoin bear markets last?
The four deepest drawdowns took 359 to 1,177 days from peak back to a new high, and in every one the recovery leg took longer than the fall — up to 4.9 times longer. The longest wait between highs ran from December 2013 to February 2017.
How deep is the current bitcoin drawdown?
As of 26 July 2026, bitcoin closed 47.6% below its all-time-high close of $124,740 from 6 October 2025. The deepest close of the episode so far was $58,566 on 30 June 2026 — 53.0% under the peak — making this the seventh-deepest episode in our fifteen-year series.
Are ether’s drawdowns worse than bitcoin’s?
Consistently. Ether’s deepest episode reached −94.0% in 2018 against bitcoin’s −83.2%, its median day sat 52.2% below its prior peak, and its longest wait for a new high — 1,383 days, into August 2025 — exceeded anything in bitcoin’s record over the same span.
Do these numbers predict the next drawdown?
No. They are a description of one asset’s fifteen-year record — a handful of independent episodes, not a distribution to project forward. We publish them as context for position sizing and planning, not as a forecast of depth, timing or recovery.