
How Correlated Are Bitcoin and Ether, Really?
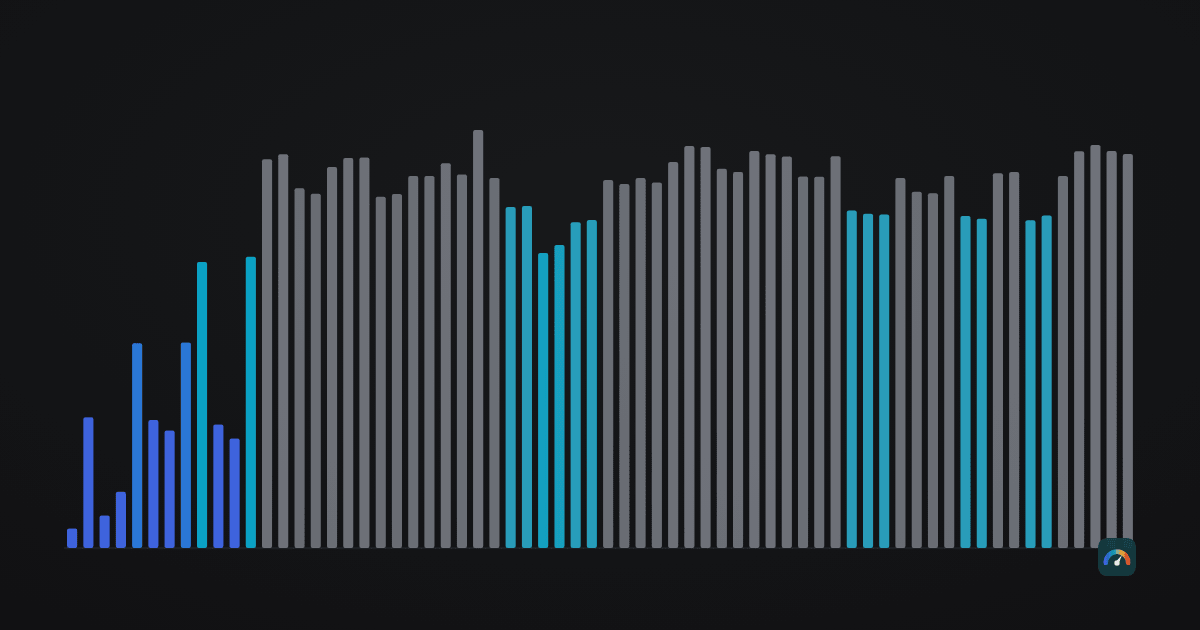
Our bitcoin-versus-ether comparison settles this question in a single line: across the window where both assets trade on the same venue, their daily returns correlate at 0.797 — on a scale where 1 means moving in lockstep and 0 means no connection at all. Accurate, and not very useful. One figure covering nine years cannot say whether the pair has always moved this closely, whether the link loosens when a holder would most want it to, or what owning both does to the ride. Those questions need the correlation as it really exists: a number that moves.
The short answer first, for anyone reading no further: since early 2018 the two have mostly moved as one asset. On all 145 days since April 2018 when bitcoin closed 5% or more down, ether fell too, and a 70% bitcoin / 30% ether mix has carried more volatility than bitcoin alone, not less. The rest of the article is the evidence, the exceptions — they cluster in rallies, not crashes — and the limits of reading either into the future.
So this article recomputes it across every 90-day window our data allows and reads the path that comes out. All figures use our own daily UTC closes — CoinGecko for recent days, Binance daily candles from 17 August 2017, and before that Bitstamp for bitcoin and Bitfinex for ether (see our methodology). The two series overlap on 3,792 days, 9 March 2016 to 26 July 2026, which gives 3,791 daily log returns and 3,702 rolling readings. What follows is a description of one pair’s past, not advice, and the limitations near the end are half the article.
What a rolling correlation measures
Take the daily logarithmic returns of both assets — day-to-day percentage moves, measured on a log scale so that gains and losses weigh symmetrically — on the days both have a close, line up the last ninety of them and compute the Pearson correlation. Read +1 as “every day, both moved the same way in the same proportion”, 0 as “knowing one told you nothing about the other”, −1 as a mirror. Each reading is dated by the last day of its window, so “today’s correlation” means the ninety days ending today.
Ninety days is a compromise between noise and lag. A 30-day window on the same data has almost the same median — 0.841 against the 90-day’s 0.831 — and far more drama: it has printed as low as −0.76 (21 April 2017) and spends 14.1% of its life below 0.5, mostly because single outlier days enter and leave a short window. Right now the two lengths agree anyway: 0.876 over ninety days, 0.888 over thirty.
Ten years in one line
Today’s 0.876 sits at the 71st percentile of all 3,702 readings — high-normal rather than extreme. The median is 0.831, the pair has spent 60.4% of its rolling history at 0.8 or above and 14.0% at 0.9 or above, and the highest reading in the record is 0.960, on 11 January 2023. In everyday terms: on a typical day of the last ninety, once you knew what bitcoin had done, ether’s move held little surprise.
The shape matters more than any single reading: an ascent, then a plateau that has now held for eight years. The current run of readings at 0.8 or above is 282 long.
The two years when they really were two assets
The low left-hand end of that line is not noise. Before April 2018 the 90-day reading spent 69.8% of its life below 0.5, with a median of 0.267. It bottomed at −0.24 in June 2016, went below zero once more through late 2016 — the last negative print landed on 1 January 2017 — and still sat at 0.03 on 20 December 2017 — a fortnight in which bitcoin and ether were, statistically, unrelated instruments. Ether was then a two-year-old asset, thinly traded enough that market-wide moves did not dominate its own flow.
One data caveat belongs to that stretch specifically. Before 17 August 2017 our two series come from different exchanges — bitcoin from Bitstamp, ether from Bitfinex — and any difference in how two venues stamp a daily close pushes measured correlation down. Read that era as directionally right and numerically soft. It is also why the correlation of the whole overlap is 0.696 while the same statistic from 17 August 2017 is 0.797: the two answer questions about different eras.
Whatever the cause, it ended. The 90-day reading has not printed below 0.5 since 4 February 2018, and not below 0.6 since 10 January 2021.
What counts as decoupling now
If the modern series never approaches the old lows, “decoupled” needs a modern definition, and we let the data set it rather than picking a round number: the lowest tenth of all readings since April 2018 falls below 0.72. That is the line shaded in the chart above, and by that yardstick the pair has come apart five times in eight years.
| Episode | Lowest reading | Bitcoin | Ether | ETH/BTC |
|---|---|---|---|---|
| 31 Aug – 20 Sep 2020 | 0.716 | −6.3% | −14.5% | −8.8% |
| 6 Nov 2020–18 May 2021 | 0.579 | +175.0% | +640.3% | +169.2% |
| 7 Dec 2023–15 Mar 2024 | 0.694 | +60.6% | +58.9% | −1.1% |
| 25 Nov 2024–20 Feb 2025 | 0.682 | +5.7% | −19.8% | −24.1% |
| 22 Jul – 9 Oct 2025 | 0.677 | +1.5% | +16.6% | +14.9% |
The September 2020 entry lasted three readings and appears only because the rule put it there. The other four are real. The longest ran from 6 November 2020 to 18 May 2021, with 148 readings below the threshold, and the last three columns explain it: bitcoin nearly tripled while ether went up more than sevenfold. The pair had not stopped moving together — ether was simply moving very much further, and a size gap that large registers as a difference in behaviour.
The others tell the same story with different signs: in late 2024 bitcoin gained 5.7% while ether lost 19.8%. Decoupling in this record is almost always the ETH/BTC ratio moving fast in one direction or the other, and almost never the two assets ignoring each other.
It tightens exactly when you would prefer it not to
Sort the readings since April 2018 by what bitcoin was doing over the same ninety days and the asymmetry is sharp. When bitcoin’s 90-day move was positive the correlation averaged 0.80; when it was negative it averaged 0.87. Of the windows in which bitcoin rose, roughly one in five sat below the decoupling threshold. Of the windows in which bitcoin fell, fewer than one in two hundred did.
Distance from the highs says the same thing. With bitcoin 30% or more below its record high, the average reading is 0.861; with bitcoin within 10% of a high, 0.763. And through the crash of February 2026 — bitcoin’s close fell from $95,593 on 15 January to $62,778 on 5 February — the 90-day correlation was 0.912 on the day of the low, near the top of its own range.
At the level of single days the picture is blunter. Since April 2018 bitcoin has had 1,491 down days and ether fell on 1,219 of them (81.8%). On the 145 days bitcoin lost more than 5%, ether fell on all 145. Across the worst 1% of bitcoin’s days — thirty of them — bitcoin averaged −13.3% and ether −17.1%. Across the best 1%: bitcoin +11.5%, ether +10.2%. In this sample ether has been the bigger loser on the worst days and the smaller winner on the best ones. That is what these eight years contain, not a forecast of the next one.
Year by year, and how big the move was
Correlation ignores size: two assets can correlate at 0.9 with one moving twice as far as the other every day. Beta answers that question: the ratio by which ether has moved for a given bitcoin move. Correlation says “in the same direction”. Beta says “and this much further”.
| Year | Correlation of that year’s daily returns | Average 90-day beta |
|---|---|---|
| 2016 (from 10 Mar) | 0.06 | 0.16 |
| 2017 | 0.41 | 0.57 |
| 2018 | 0.82 | 1.11 |
| 2019 | 0.82 | 1.10 |
| 2020 | 0.87 | 1.12 |
| 2021 | 0.78 | 1.03 |
| 2022 | 0.90 | 1.18 |
| 2023 | 0.83 | 0.96 |
| 2024 | 0.80 | 0.96 |
| 2025 | 0.82 | 1.46 |
| 2026 (to 26 Jul) | 0.91 | 1.26 |
Today’s 90-day beta is 1.24; over the last 365 days it is 1.34. Its median since April 2018 is 1.10 and it has stood above 1 on 66.1% of readings — ether usually moves further than bitcoin, but not always: 2023 and 2024 both averaged 0.96. The highest 90-day reading in the record is 2.17, in November 2018. The 2025 average of 1.46 is the largest of any year in our data.
Correlation is not a shared fate
Two assets can correlate at 0.9 and still finish in completely different places, because correlation is blind to both scale and drift: it describes the co-movement of daily returns, not where those returns add up to. Ether’s price measured in bitcoin has gone from 0.07048 on 17 August 2017 to 0.02989 today, a fall of 57.6%, over a period when the daily correlation averaged around 0.8. That gap is history, not a trend to extrapolate — but it is why a high correlation says nothing about which coin ends up ahead.
“They move together” and “they arrive at different destinations” are both true and not in tension. Correlation is a statement about the ride; the ratio, which our comparison article covers in detail, is a statement about the result.
The compare tool runs the same $100 through both assets, next to the S&P 500 and gold, and shows where each arrives.
What owning both actually buys
The arithmetic is worth doing once, on real numbers. Over the last 365 days bitcoin’s annualised volatility was 43.1% and ether’s 66.4%. A fixed 70% bitcoin / 30% ether blend — the weighting our own index uses, a measurement choice and not a portfolio suggestion — would have run at 48.6%, against 36.2% had the two been uncorrelated. Note where 48.6% sits: above bitcoin alone. Mixing ether into bitcoin raised the volatility of the pair instead of lowering it, because the correlation was far too high for ether’s extra motion to cancel against anything.
That is the entire diversification calculation, and it says nothing about which asset anyone should own. What a split does buy is real but different: it hedges the risk of being wrong about one asset in particular — a protocol-level failure, a regulatory action aimed at one and not the other, a shift in which asset large buyers prefer. It does not measurably reduce exposure to crypto as a whole. Not financial advice.
Limitations worth knowing
- Overlapping windows are not independent observations. Consecutive readings share 89 of their 90 days, so the 3,702 readings here re-measure roughly forty non-overlapping stretches and every percentile inherits that. It is the caveat that governs our implied-volatility comparisons too.
- Pearson correlation measures one kind of togetherness. It is linear and dominated by the largest days — a handful of crashes can carry a whole window — and it says nothing about which asset moves first.
- Correlation of returns is not correlation of outcomes. The 57.6% fall in the ETH/BTC ratio happened through a correlation near 0.8, not despite it. A high reading tells a holder about the shape of the ride, not about the destination.
- The early era is cross-venue. Everything before 17 August 2017 pairs Bitstamp closes with Bitfinex closes, which biases measured correlation downward by an unknown amount. Those numbers describe a real phenomenon less precisely than their decimals suggest.
- One pair, one history, and our choices. The window length, the decoupling threshold and the merge rule for episodes are all our decisions, and other reasonable choices would move the episode table. Ten years of two assets is a small sample whatever the method.
How a holder can use it
Mainly as a check on a story you may be telling yourself. If the reason for owning both is “the second will hold up when the first falls”, this record does not support it: since 2018 the correlation has been highest precisely during declines, and there is no day since April 2018 on which bitcoin fell more than 5% and ether did not fall too. If the reason is “I do not know which of the two ends up mattering”, the record says nothing against you — that risk is real, and a split genuinely addresses it.
It is also a slow number: it stays in a band for years and moves when a rally pulls the two apart, so checking it monthly is plenty. The ETH/BTC ratio on the markets page answers the question a two-asset holder asks more often — is the ether side doing anything the bitcoin side is not?
Frequently asked questions
How correlated are bitcoin and ethereum?
Very. The correlation of daily logarithmic returns over the ninety days to 26 July 2026 is 0.876, and the median of all 3,702 rolling 90-day readings in our data is 0.831. Across the whole window in which both assets trade on the same venue, from 17 August 2017, the figure is 0.797. The pair has spent 60.4% of its rolling history at 0.8 or above.
Do bitcoin and ether ever decouple?
Rarely, and not when it would help. Using the lowest tenth of readings since April 2018 — below 0.72 — as the definition, the pair has come apart five times in eight years, and bitcoin was rising through four of them. In falling markets the correlation goes up: it averaged 0.87 in 90-day windows where bitcoin fell against 0.80 where it rose, and printed 0.912 on the day of the February 2026 low.
Does holding both bitcoin and ether diversify a portfolio?
Not in the volatility sense. Over the last 365 days bitcoin’s annualised volatility was 43.1% and ether’s 66.4%; a fixed 70% bitcoin / 30% ether blend would have run at 48.6% — higher than bitcoin alone, and far above the 36.2% those weights would produce if the two were uncorrelated. What a split does reduce is the risk of being wrong about one specific asset, which is a different thing from reducing exposure to the market.
What is ether’s beta to bitcoin?
Its 90-day beta — how far ether moves for a given bitcoin move — is 1.24 as of 26 July 2026, with a median of 1.10 since April 2018 and readings above 1 on 66.1% of days. The record high is 2.17 in November 2018. Ether usually moves further than bitcoin for the same market move, though 2023 and 2024 both averaged slightly below 1.