
Is Bitcoin Getting Less Volatile?
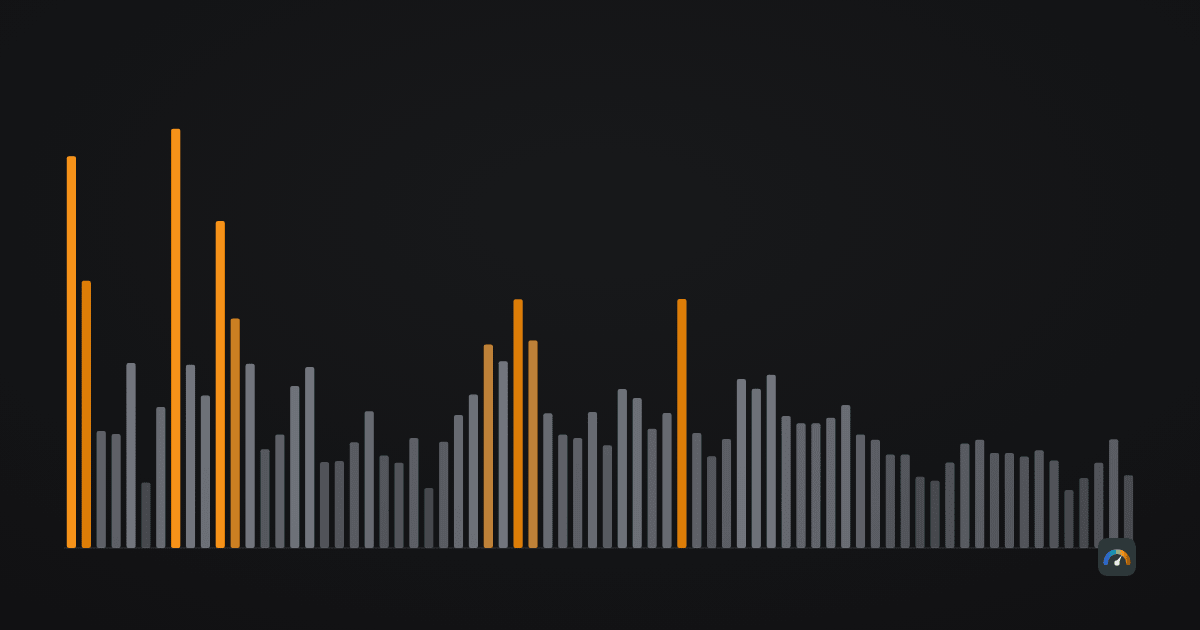
Every second market review says it: bitcoin is maturing, the wild swings belong to its childhood, the asset is settling down. It is a pleasant story, and a testable one, because the swings leave a number behind. Realized volatility — how far the price actually moved, day by day, after the fact — can be computed for every ninety-day stretch of the last fifteen years and read off.
The short answer first, for anyone reading no further: yes, but weaker and messier than the phrase suggests. Bitcoin’s volatility over the last ninety days works out to 34.6% a year — a typical day of about ±1.8%, roughly ±$180 on a $10,000 position — against a median of 62.1% across its whole history. But the decline has not been steady: it stalled for a four-year stretch, one recent year is higher than the one before it, and half the long-run slope comes from bitcoin’s first three years alone. And a calmer number is not a safer asset: this January produced one of the quietest readings in fifteen years, three weeks before the price lost a third.
Every figure below comes from our own daily UTC closes — CoinGecko for recent days, Binance from August 2017, earlier Bitstamp and Bitfinex (details in our methodology): 5,457 bitcoin closes from 18 August 2011 and 3,792 ether closes from 9 March 2016. This is the backward-looking half of the volatility question; the forward-looking half — what the options market expects — lives in our article on implied volatility and DVOL. What follows describes one asset’s past. It is not a forecast of volatility and not advice.
What realized volatility measures
Take the daily logarithmic returns — the day-to-day percentage moves of the price — take their standard deviation over the last ninety of them (how far a typical day strays from the average), and multiply by the square root of 365 to annualise it. Dividing that yearly-pace figure back by 19.1 turns it into an everyday one: 34.6% a year is a typical day of about ±1.8%, 100% a year is about ±5.2%, and the record reading of 223% is about ±11.7% every day for three months.
Ninety days is long enough that one dramatic session cannot carry the number, short enough to show regimes rather than eras. Each reading is dated by the last day of its window, so “today’s volatility” means the ninety days ending today. And “typical” is doing real work there: standard deviation describes the ordinary days, and crypto’s worst days sit far outside the ordinary.
Fifteen years in one line
Today’s 34.6% sits at the 6th percentile of all 5,367 bitcoin readings — quieter than 94% of the last fifteen years. The median reading is 62.1%, the highest is 223.4% (the ninety days to 14 May 2013), the lowest is 23.6% (to 26 May 2016). Ether today reads 48.9%, also near the bottom of its own range at the 6th percentile of 3,702 readings, against an ether median of 81.0%. Quiet, that is — not safe; the February section below is the difference.
Percentiles against fifteen years flatter the present, though, because much of that history is bitcoin at $10. Measured only against 2023 onwards, today’s reading sits at the 11th percentile of a stretch whose median is 46.6% — still low, but low against a market that had already calmed down.
The trend, tested
“Getting less volatile” is a claim about a slope, so fit one. Each calendar year gives one independent measurement — no overlapping windows — and a straight line through bitcoin’s sixteen years falls at 5.8 percentage points a year, from about 123% fitted in 2011 to about 36% fitted in 2026. It accounts for roughly half the variation between years (R² 0.51), and year and volatility rank in mostly falling order (rank correlation −0.77). On the face of it, the narrative is confirmed.
Now the honesty. Sixteen points is a very small sample to fit anything to: the standard error on that slope is 1.5 points, so the rough 95% range runs from −8.9 to −2.8 points a year — the direction is solid, the size is not. The slope also depends on where the record starts. Drop bitcoin’s first three years, when it traded at $10 on a handful of venues, and the fitted decline halves to 2.7 points a year, R² 0.35. Much of “bitcoin is calming down” is really “bitcoin stopped being a curiosity in 2013”.
The blunter comparison agrees but says less. Split the rolling record in half at 22 March 2019 and the median reading falls from 69.8% to 55.1%; by calendar years, the median of the first eight is 84.9% against 58.5% for the last eight. Ether fits a steeper line on eleven years — 6.2 points a year, R² 0.62 — but started so much higher that it is still at 48.9% today.
Where the line stops being a line
A fitted slope hides the shape, and the shape has a flat spot. Grouped into four-year eras, the median 90-day reading for bitcoin runs 92% (2011–2014), 65% (2015–2018), 68% (2019–2022), 47% (2023–2026). The third era is higher than the second: whatever was calming bitcoin through the middle of the last decade stopped for four years, then resumed.
Single years say it louder. Bitcoin printed 48% in 2016 — quieter than 2017, 2018, 2019, 2020, 2021 and 2022, all of which came after it. And ether has lately gone the other way: 47% in 2023, 64% in 2024, 75% in 2025, 64% so far in 2026. Three consecutive years of rising volatility, in the middle of the maturing story.
The wildest ninety days, and the quietest
| Ninety days ending | Annualised volatility | Bitcoin over that window |
|---|---|---|
| 14 May 2013 | 223.4% | $25 → $107 (+328%) |
| 26 Nov 2011 | 214.8% | $10.00 → $2.77 (−72%) |
| 28 Dec 2013 | 182.7% | $127 → $715 (+463%) |
| 24 Feb 2012 | 143.3% | $2.77 → $4.95 (+79%) |
| 22 Feb 2018 | 141.9% | $8,138 → $9,811 (+21%) |
Two things stand out. Extreme volatility is not a synonym for falling: only one of the five windows covers a net decline, and the wildest reading of all covers a quadrupling. And nothing in the last eight years comes close — the most recent entry ends in February 2018.
The quiet end matters more to a holder, because it contains the present. The calmest window in fifteen years ended 26 May 2016 at 23.6%, bitcoin drifting from $432 to $452; the second-calmest also belongs to 2016. But the third-calmest ended on 21 September 2025 at 27.8%, with bitcoin between $105,334 and $115,256 — a coin worth two hundred times more, moving no more than it did at $432. That is the maturity claim in its strongest form, and it is real — with the one caveat the next section is about: that same quiet stretch ended less than five months before the price lost half.
What actually disappeared: the clusters
Averages describe volatility poorly, because volatility clusters: rough days arrive next to other rough days, and the question worth asking is not “how much on a normal day” but “how long did the market stay in its extreme regime”. Take 100% a year — roughly ±5.2% a day — as the line for that regime. Bitcoin has spent 881 days above it in 15 episodes, 16.4% of all its readings.
| Episode | Days above 100% | Peak reading |
|---|---|---|
| 16 Nov 2011–16 Apr 2012 | 153 | 214.8% |
| 22 Dec 2017–5 May 2018 | 135 | 141.9% |
| 18 Nov 2013–18 Mar 2014 | 121 | 182.7% |
| 10 Apr – 20 Jul 2013 | 102 | 223.4% |
| 12 Mar – 9 Jun 2020 | 90 | 135.1% |
The last day bitcoin’s 90-day reading stood above 100% was 9 June 2020 — 2,238 days, just over six years, ago. That is a sharper statement than any regression: not that the average drifted down a few points, but that an entire regime has not appeared since mid-2020, through a halving, a bear market and the crash of February 2026. Ether says the same on a shorter clock: 16 episodes, 1,025 days, the last ending 13 September 2022.
Where it stands today
Bitcoin reads 34.6% over the ninety days to 26 July 2026, its last reading above 60% dated 28 April; ether reads 48.9%. The gap between them is the most stable fact here: ether’s 90-day volatility has exceeded bitcoin’s on 97.4% of the 3,702 days both have a reading, median gap 20.4 percentage points. Whatever calming has happened has not closed that distance.
One cross-check, since we store both numbers: Deribit’s DVOL — the options market’s own 30-day volatility forecast — closed today at 37.3 for bitcoin and 51.7 for ether, against realized readings of 34.6% and 48.9%. Options are priced a little above what the last ninety days delivered — an ordinary configuration, and the subject of the implied-volatility article rather than this one.
A calmer average is not a safer asset
February 2026 is the test case. On 15 January the 90-day reading was 38.1% — deep in the calm regime. Bitcoin then fell from $95,593 to $62,778 by 5 February, where the reading stood at 50.5%. It peaked at 60.8% on 19 April, never once approaching the old 100% line, though the shorter 30-day measure did reach 83.4% on 4 March. That fall was one leg of the decline that began at the October 2025 high and reached 53% below it on 30 June 2026 — the seventh-deepest episode in our fifteen-year drawdown record.
So a third of bitcoin’s value disappeared in three weeks inside a regime these numbers call quiet — and the third-calmest 90-day window in the whole record had ended less than five months earlier. Daily volatility measures the width of the everyday wobble, not how far the price can travel in one direction. Reading a falling volatility number as a smaller chance of a deep drawdown is reading the wrong instrument. Not financial advice.
Limitations worth knowing
- Overlapping windows are not independent observations. Consecutive readings share 89 of their 90 days, so the 5,367 readings here re-measure roughly sixty non-overlapping stretches, and every percentile and share inherits that. The calendar-year figures and the fitted line avoid the problem; the rolling ones do not.
- Sixteen points, one straight line. A regression on sixteen annual observations is a weak instrument, and this one is visibly sensitive: dropping the first three years halves the slope. A straight line is also the wrong shape for a series that fell, sat still for four years and then fell again.
- Standard deviation is blind to direction and to jumps. It treats a 10% rise and a 10% fall identically, and a market that gaps once and then sits still can print a modest reading. It describes the middle of the distribution, which is exactly where crypto’s most damaging days are not.
- The early years are thin. The 2011–2013 readings that carry most of the fitted slope come from a market of a handful of exchanges and cent-rounded Bitstamp closes. Those numbers are real, but they describe a different kind of market, not a louder version of this one.
- No volatility comparison with other asset classes. The compare tool holds daily S&P 500 and gold series next to bitcoin and ether, but we have not built the same volatility pipeline for them, so any line about equities’ volatility would be a number we could not check. We leave it out rather than borrow it.
How a holder can use it
Mostly as a unit converter for the news. At 34.6% a year, a 2% day is the market working normally, not an event — a feed that calls every red candle a crash is calibrated to a regime that ended six years ago. Rechecking that expectation against the markets page once a month is plenty; it is a slow number.
The second use is as a check on the maturing story itself. The record supports a long, uneven decline and the absence of the 100%-a-year regime since 2020. It does not support extrapolating either into a promise about the next five years, and it says nothing about the depth of the next drawdown. A four-year flat spot already sits in this record; another would not be news.
Frequently asked questions
Is bitcoin getting less volatile?
On the long arc, yes. A straight line fitted to bitcoin’s sixteen calendar years of annualised realized volatility falls 5.8 percentage points a year, from about 123% fitted in 2011 to about 36% in 2026, and the median 90-day reading fell from 69.8% in the first half of our record to 55.1% in the second. But the path is not a slope: bitcoin printed 48% in 2016, quieter than every year from 2017 to 2022 that followed it, and dropping its first three years halves the fitted decline to 2.7 points a year.
What is bitcoin’s volatility right now?
Over the ninety days to 26 July 2026, bitcoin’s annualised realized volatility is 34.6% — a typical daily move of about ±1.8%. That sits at the 6th percentile of all 5,367 readings since November 2011, and at the 11th percentile measured only against 2023 onwards. Ether reads 48.9% over the same window, near the bottom of its own range too.
Does lower volatility mean smaller crashes?
Not in our record. Bitcoin’s 90-day volatility was 38.1% on 15 January 2026, and the price then fell from $95,593 to $62,778 by 5 February, one leg of the decline that has since become the seventh-deepest in our fifteen-year record. Through all of it the 90-day reading peaked at 60.8%, far below the 100%-a-year regime of the 2010s. Volatility describes the width of the everyday move, not how far the price can travel in one direction.
What is the difference between realized and implied volatility?
Realized volatility is measured from prices that have already happened: the standard deviation of daily log returns over a past window, annualised. Implied volatility is derived from what traders currently pay for options — an expectation about the next thirty days. Today they read 34.6% and 37.3 respectively for bitcoin. Our separate article on DVOL covers the implied side.