
How Long to Hold Bitcoin? Every Start Date Since 2011
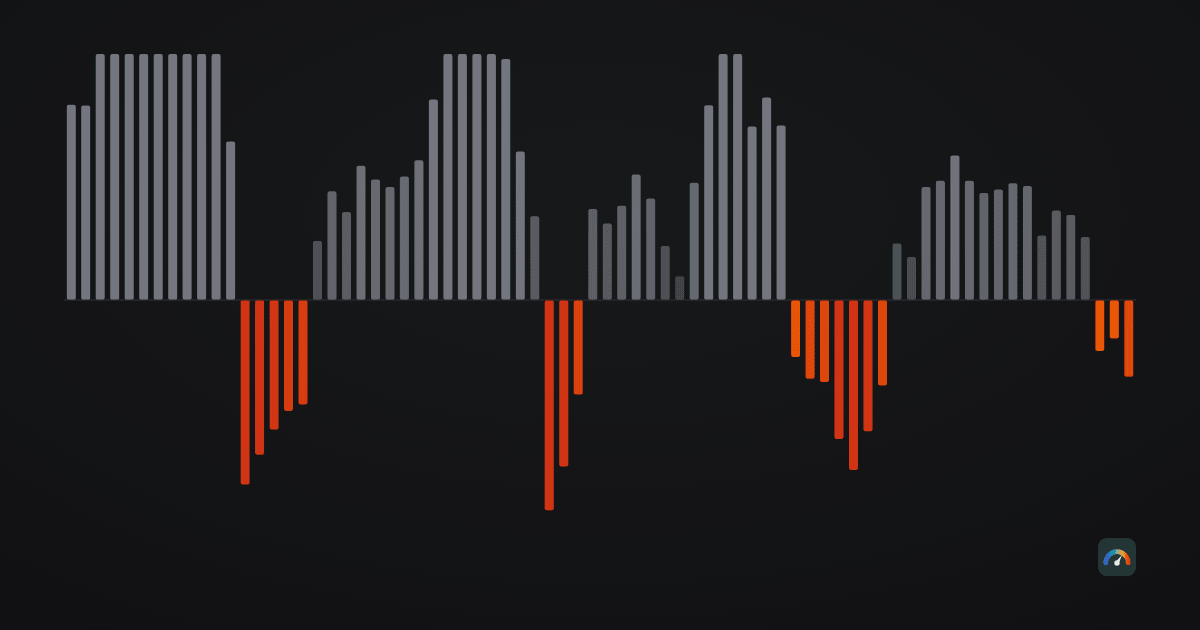
The question a long-term holder actually has is rarely “what will price do tomorrow.” It is closer to: if I buy today and simply wait, what has that historically produced? Unlike most questions about the future, this one has a fully computable past. Take every day in our price history as a hypothetical entry, hold for a fixed period, record the result, and you get a census of what one, two and four years of holding has actually delivered from every possible starting point.
That census is what our holding-periods tool draws live, and this article walks through what it currently shows and — just as important — what a table like this cannot claim. It is a description of one asset’s past, not advice, and the sample problems discussed at the end are not a footnote; they are half the story. All figures use our own daily UTC closes through 26 July 2026 — bitcoin from Bitstamp, from 18 August 2011; ether from Bitfinex, from 9 March 2016 (see our methodology). One purchase, one exit, no fees, no taxes — real costs would lower every number.
How the census works
For a horizon of, say, one year, we take each day of history as an entry date and compare its close with the close 365 calendar days later. Do that for every day with enough future left and you get 5,092 one-year outcomes for bitcoin. It is not a strategy or a backtest: nothing is optimised, nothing is timed — it is closer to a survey of everyone who ever bought on some day and held for exactly a year.
Bitcoin: one year stings, four years never lost
| Held for | Entries | Ended in loss | Lost 50%+ |
|---|---|---|---|
| 1 year | 5,092 | 27.0% | 10.2% |
| 2 years | 4,727 | 17.3% | 3.1% |
| 4 years | 3,997 | 0.0% | 0.0% |
| Held for | 10th pctile | Median | 90th pctile | At least doubled |
|---|---|---|---|---|
| 1 year | −50.8% | +92.1% | +775.4% | 47.9% |
| 2 years | −26.4% | +229.8% | +2,761.3% | 64.2% |
| 4 years | +152.6% | +1,170.3% | +5,503.2% | 93.6% |
Each row is a different asset, psychologically. The one-year row is close to a weighted coin: nearly three losing starts in ten, and one start in ten lost half or more — the 10th-percentile one-year outcome is −50.8%. The worst single start in the series bought the 16 December 2017 peak and sold a year later down 83.1%.
Stretch the horizon and the distribution drags upward. At two years, losing starts drop to one in six, and losing half becomes rare (3.1%). At four years the record contains no losing start at all — 3,997 entries, zero below water, 93.6% of them at least doubled. That is the statistic behind every “just hold four years” post ever written, and it deserves the two paragraphs of scrutiny it rarely gets.
The four-year rule, read carefully
First, the near miss. The weakest four-year outcome in the table bought on 9 April 2021 — near the first 2021 peak — and exited on 8 April 2025 up just 31.3%. Four years, a 76.6% drawdown in the middle, and a result far below what the rest of the four-year row implies. “Never lost” and “always paid well” are different claims; the record supports only the first.
Second, the sample is smaller than 3,997 suggests. Overlapping windows are not independent evidence — consecutive entries share almost all of their history, so those thousands of four-year outcomes compress to roughly three non-overlapping observations. The claim “no four-year loss” rests on how three-ish distinct stretches of one asset’s history happened to resolve, and the last usable entry is 27 July 2022: anyone who bought after that simply has no four-year verdict yet. The current episode’s buyers of late 2025 are in the untested region of the chart.
Third — and this is the strongest argument against leaning on the rule — ether already violates it.
Ether: the same table, a different story
| Held for | Entries | Ended in loss |
|---|---|---|
| 1 year | 3,427 | 38.5% |
| 2 years | 3,062 | 31.4% |
| 4 years | 2,332 | 10.9% |
| Held for | 10th pctile | Median | 90th pctile | At least doubled |
|---|---|---|---|---|
| 1 year | −53.6% | +42.7% | +1,244.5% | 30.2% |
| 2 years | −52.2% | +84.9% | +1,974.3% | 47.3% |
| 4 years | −4.6% | +730.5% | +3,243.5% | 76.8% |
One four-year entry in nine ended in loss — 254 of 2,332, the worst of them buying 8 May 2021 and exiting May 2025 down 53.7%. Halving the money over four years of waiting is inside ether’s record, while remaining outside bitcoin’s. The medians tell the same story from the other side: ether’s typical outcome trails bitcoin’s at every horizon despite its famous best cases (a top-decile one-year entry returned over +1,244%, against bitcoin’s +775.4%). Wider in both directions, weaker in the middle — consistent with everything else in our BTC-versus-ETH comparison.
For a holder the practical reading is blunt: whatever confidence the four-year record earns for bitcoin does not transfer to other assets by analogy. Each asset’s contract is its own.
Why longer horizons help, mechanically
Nothing mystical drives the improvement from row to row. Bitcoin’s history so far consists of drawdowns lasting up to three-and-a-bit years threaded through a rising long-term trend. A one-year window fits entirely inside a bear market; the twelve months from the December 2017 peak were exactly that, which is where the −83.1% worst case comes from. A four-year window has so far always overlapped enough of an advance to climb out — the longest stretch without a new high in our series is 1,177 days, just under the 1,460-day horizon. That is an observation about how the cycles have happened to space themselves, not a law. A four-year drought longer than any so far would put losses in the four-year row the day it happens, as it already has for ether.
This is also why the census pairs naturally with the halving-cycle comparison: the four-year horizon owes its shape to the roughly four-year rhythm the market has kept so far, and inherits all the fragility of a pattern with very few repetitions.
What the census cannot say
- It is one path, not a distribution. Thousands of overlapping windows re-measure the same fifteen years. “27% of one-year entries lost money” describes bitcoin’s single realised history; it is not a 27% probability for the year ahead.
- Long horizons exclude recent history. The four-year row cannot see any entry after July 2022 by construction. Whatever the 2025–2026 drawdown does to four-year outcomes is not in the table yet — a bias toward the past, not a neutral omission.
- Lump entries are the model, not the common case. Most people accumulate over time rather than buying once. Spreading entries mixes many rows of this table into one outcome — our DCA guide measures that directly, and the calculator runs any schedule you like.
- It does not condition on where you are standing. Every entry date is averaged in together, whether it followed a fresh high or a 50% crash. The table cannot say what happened next specifically to buyers who were already deep in a drawdown — a question this data can be asked, but this article does not ask.
- Nobody experiences the median. Each holder gets one draw, including whatever happened along the way — the 9 April 2021 entry spent 1,030 of its 1,461 days below its own purchase price, 824 of them unbroken, and was 72.9% down at the worst of it before finishing +31.3%. The drawdown history is the companion piece on what the waiting itself has looked like.
How a holder can use it
As a horizon check, mainly. The table’s honest summary is: over this asset’s short history, one-year holds were regularly punished, four-year holds so far never were — with a sample too small to promise anything and one sister asset already showing the exception. If money you plan to hold has a real chance of being needed inside a year, the one-year row — 27% of entries down, one in ten down by half — is the row you are actually choosing. The live tool shows the full distribution for each horizon, updated daily, including the histogram of multiples this article has only summarised.
Frequently asked questions
How long do you need to hold bitcoin to be profitable?
History offers a record, not a guarantee. Across every daily entry since August 2011, 27.0% of one-year holds ended in loss, 17.3% of two-year holds, and 0.0% of four-year holds. Those figures describe one asset’s single past, built from overlapping windows — not a probability for the future.
Has bitcoin ever lost money over four years?
Not in our daily-close series: all 3,997 four-year entries from 2011 through July 2022 ended positive. But the weakest gained only 31.3%, the sample compresses to roughly three independent observations, and entries after July 2022 have no verdict yet.
Does the four-year rule work for Ethereum?
No. In ether’s record 10.9% of four-year entries ended in loss — 254 of 2,332 — with the worst, bought 8 May 2021, down 53.7% four years later. The bitcoin four-year record does not transfer to other assets by analogy.
What was the worst one-year period to buy bitcoin?
Buying the 16 December 2017 peak: one year later the position was down 83.1%. The best was buying 29 November 2012, up over 9,000% a year later. The one-year distribution is extremely wide in both directions.
Why do longer holding periods look so much safer?
Bitcoin’s drawdowns have so far lasted at most 1,177 days between all-time highs — just under the four-year horizon — so every four-year window has overlapped enough of an advance to recover. That is a fact about how past cycles were spaced, not a law about future ones.
Is buying everything at once better than spreading purchases?
They answer different fears. A single entry takes one draw from the distributions in this article; spreading entries averages many draws, giving up the best outcomes to soften the worst. Our DCA guide and the /dca calculator measure both approaches on the same data.