
Lump Sum or DCA into Bitcoin? What Averaging Actually Buys
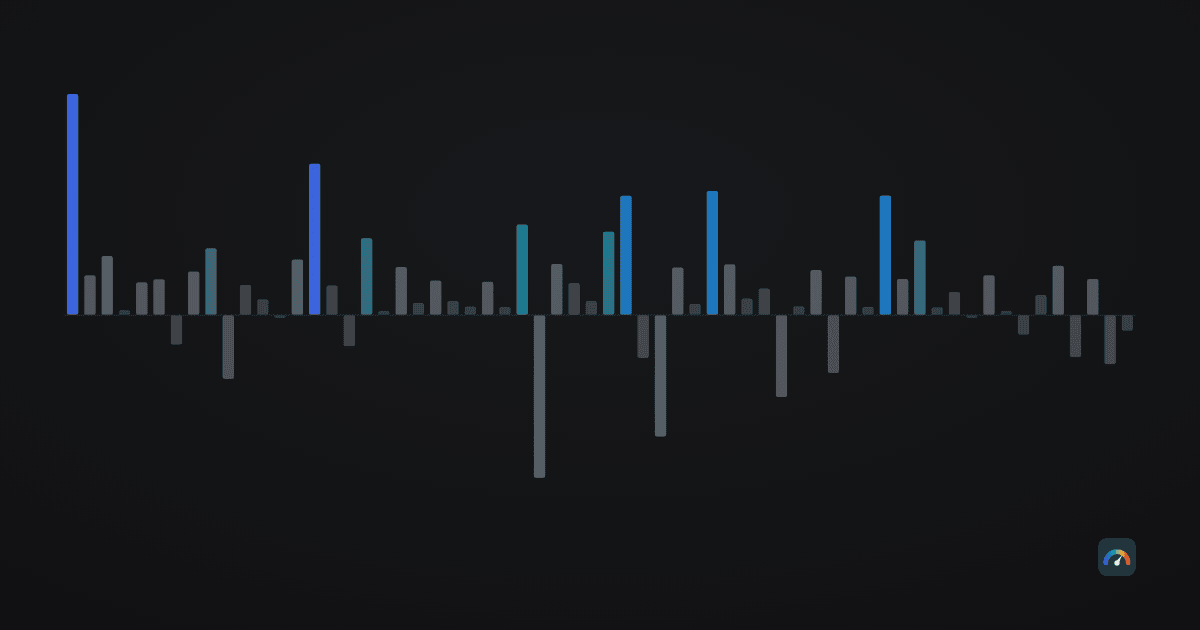
The honest headline is the one that disappoints. If the whole sum was already sitting in your account, putting it into bitcoin on day one beat feeding it in weekly over most of this price history. Across four-year windows the single purchase finished ahead on 83.2% of start dates. Across one-year windows it finished ahead on 70.2%. Both figures come from our DCA calculator, which prints them in its own FAQ and recomputes them daily. That is not really a fact about averaging. It is a fact about an asset that mostly rose, and it would read much the same for anything else that mostly rose.
This article is about the other column of the ledger, the one an average cannot show. Across the 5,095 bitcoin start dates with a full year of prices after them, money committed all at once was worth less than half of itself at some point during that first year on 23.0% of start dates. The same sum split into twelve monthly purchases reached that mark on 4.0% of them. Split into twenty-four monthly purchases, on none of them. Averaging did not buy a better result — it bought a narrower left tail, and the narrowing is measurable. One caution belongs with that count before it does any work: consecutive start dates overlap almost completely, so they are not 5,095 independent facts — they are roughly fourteen non-overlapping years of price history, seen from 5,095 angles.
If you read nothing else: on this record the choice was a priced trade, not a free lunch. Spreading a bitcoin purchase over twelve months cost about 31% of the median four-year result and removed roughly four-fifths of the start dates whose money halved inside the first year. Whether that is worth paying depends on how large the sum is next to everything else you own, and on whether you would still be holding on the day the screen shows a third of what you paid — not on which side the averages favour. This is a description of past outcomes, not a recommendation.
How the comparison is set up
Both strategies are handed the same money on the same day. The lump sum buys everything at that day’s close. A DCA schedule of n purchases splits the sum into n equal parts, buys the first on the same day, and buys the rest at weekly or monthly intervals. Every date in our bitcoin series that has enough history after it becomes one observation, which is what turns a debate into a census. The choice is also not binary: putting part of the sum in on day one and averaging the rest is a point on the same scale, and the schedules below are that scale rather than a menu of two.
One wrinkle about the word “weekly”, because two different schedules answer to it. The 83.2% and 70.2% above come from the DCA calculator, which spreads weekly purchases across the whole horizon — 53 buys in a one-year window and 209 in a four-year one, so the last instalment lands on the finish line. Every table and chart in this article instead uses a fixed number of purchases that finish early and then simply hold: 12 weekly buys are done in three months, 12 monthly buys in a year. The two are not versions of one number and are not expected to agree — that is why the “3 months (12 weekly buys)” row below reads 59.0% rather than 83.2%.
Four definitions carry the rest of the article:
- The worst first-year mark. On every day of the first 365, we value the whole commitment: coins bought so far, plus the cash not yet spent. The lowest that total ever fell, as a share of the sum committed, is the number this article calls the worst mark. It is not a peak-to-trough drawdown — it is measured against what you put in, which is the figure a person actually compares against.
- Undeployed cash earns nothing. Money waiting its turn sits at 0%, and that assumption is deliberately unkind to averaging — it is the single choice here that most tilts the comparison. On a 36-month schedule the average instalment waits about 17.5 months before it buys anything, roughly a year and a half of the four-year window spent in cash; at any real deposit rate the interest earned on that idle money would come straight off the lump sum’s median lead in the table below. Read every DCA row as a floor rather than an estimate.
- Horizons are 365, 730 and 1,460 days from the start date — the same three we use in the holding-period census and in the holding-periods tool, so numbers do not drift between pages.
- No fees, no taxes. Both strategies are flattered by that, but not equally: twenty-four purchases attract twenty-four sets of costs and create twenty-four tax lots, against one for the lump sum.
One assumption does more work than all four and belongs at the top rather than in a footnote: this question only exists if you already have the money. If it arrives with a salary, in pieces, then averaging was never a strategy you selected — it is the shape of your income, and the lump sum on day one was not an option you passed up. Everything below is written for a sum that already exists in one place: a bonus, a sale, an inheritance, a deposit coming to term.
The part that is already settled
Buying all at once wins the middle of the distribution, and on the two measures of the middle — how often it finished ahead, and by how much at the median start date — it wins more decisively the longer you would have averaged. (The median start date means: line every start date up in order of outcome and take the one in the exact middle, so half of history did better and half did worse. It is not an average, and one spectacular window cannot drag it.) The last column of the table moves differently, and is dealt with below. Holding each schedule to the same four-year finish line, on every bitcoin start date with four years of prices after it:
| The sum was spread over | Lump sum finished ahead | By, at the median start date | Median four-year result | Weakest four-year result |
|---|---|---|---|---|
| Nothing — all at once | — | — | 12.68× | 1.31× |
| 3 months (12 weekly buys) | 59.0% | +5.6% | 12.60× | 1.51× |
| 12 months (12 monthly buys) | 65.3% | +30.7% | 9.53× | 1.64× |
| 24 months | 69.6% | +82.5% | 6.93× | 1.84× |
| 36 months | 75.5% | +124.4% | 5.77× | 1.54× |
One word about the fourth column before the rest: 12.68× and its neighbours are what four-year windows returned in a fifteen-year record during which bitcoin rose by orders of magnitude. They are historical multiples, not a rate you can carry forward, and nothing here says the next four years are drawn from the same distribution.
Two things in that table are worth pausing on. The first is the direction: stretching the purchases from three months to three years raised the lump sum’s win rate from 59.0% to 75.5% and its median margin from +5.6% to +124.4%. Waiting cost money, and waiting longer cost more. The mechanism is not mysterious — in a lump sum every dollar works for the full four years, while on a 36-month schedule the average dollar works for about two and a half. That gap is also why the two totals cannot be compared as plain percentages without an IRR — an internal rate of return, which measures growth per year on the money actually invested rather than on the whole sum from day one.
The second is the last column, which points the other way. The weakest four-year window in the whole record returned 1.31× to the lump sum and 1.84× to the 24-month schedule. That relationship is not monotonic either: the 36-month schedule’s own weakest four-year result, 1.54×, is worse than the 24-month schedule’s, even though its win rate and its median margin both keep rising. With roughly three non-overlapping four-year stretches in the record, a single worst case is one accident of history and moves around; the median trend is the part that stays smooth. The middle of the distribution and the bottom of it disagree, and most of the argument about this question comes from people quoting one at people quoting the other.
What the average hides: the first twelve months
Line up all 5,095 start dates from the worst first year to the best, and the two strategies separate almost entirely in the left third of the picture.
At the median start date, committing everything at once meant watching the money sit 18.2% below what was put in at its lowest point of the year — unpleasant but survivable. One start date in four went below 48.3%. The worst fifth percentile — the worst one start date in twenty — went below 70.4%, and the single worst start date of the series, 16 December 2017, bottomed at −83.2%. Worth repeating at these sizes: that is how far the money fell along the way, on its worst day of the year, not what was left at the end of it. Whether the hole was ever climbed out of is a separate question, and the four-year table above is where it gets answered.
Spread the same money over twelve monthly purchases and every one of those numbers moves: median −5.8%, lower quartile −23.9%, fifth percentile −47.2%, worst case −65.8%. Over twenty-four months they move again, to −2.9%, −11.9%, −23.6% and −32.9%. Counted instead of ranked, the tail thins like this:
The 24-month row contains no start date at all whose commitment ever halved inside its first year, and the 36-month row none that ever fell 30%. Neither is a promise about the future; both are a statement about a record covering fifteen years and the seven declines of 50% or more inside it. A crash steeper or faster than anything in that record would put entries back into those cells.
Averaging also does not win this comparison every time. Compared start date by start date, the 12-month schedule had the shallower first-year low on 78.9% of them — call it four dates in five. On 16.0% its low was the deeper of the two: these are the dates where price rose first and fell later, so the instalments bought above day one’s price. On the remaining 5.1% neither strategy ever dipped below the sum committed at all. Averaging removes the worst outcomes; it does not remove all bad ones, and it manufactures a few of its own.
Two start dates make the size of the effect concrete. A lump sum at the cycle high of 16 December 2017 bottomed at −83.2%; the same money on a 12-month schedule bottomed at −58.6%, on the same day. The live example is closer to hand: from the last all-time-high close of 6 October 2025, a lump sum was down 53.0% at the 30 June 2026 low against 20.4% for the 12-month schedule — and that window is still open until October 2026.
The middle and the tail answer different questions
Nothing above contradicts the win rates. They are answers to different questions, and both are needed. “Which gave more money at the median start date” describes a typical outcome; “how bad did it get before the outcome arrived” describes the outcomes you cannot rule out in advance. A plan is only run by the second one, because that is the version that has to be survived.
Plotted against each other, the choice stops looking like two camps and starts looking like a dial:
The dial is not linear, and where it bends is the practical finding of this article. Going from a three-month spread to a twelve-month one bought 18.5 percentage points of tail protection at the fifth percentile for about 25 points of median four-year edge. The second year of spreading bought another 23.6 points of tail, but cost roughly 52 points of edge. The third year bought only 7.9 points more and cost about 42. On this record the first year of averaging was the efficient part of the trade and the third year was mostly a fee paid for peace of mind — which is a real thing to buy, as long as the price is visible.
Ether, as a check
If the pattern only appeared in bitcoin it would be a fact about bitcoin. Running the identical calculation on ether’s shorter series — 3,430 start dates with a full year after them, from 9 March 2016 — gives the same ordering with harsher numbers throughout:
| Ether, first 12 months | Median worst mark | 5th percentile | Worst | Ever below −50% |
|---|---|---|---|---|
| All at once | −36.0% | −83.1% | −94.0% | 31.5% |
| Spread over 12 months | −17.4% | −60.1% | −78.6% | 9.7% |
| Spread over 24 months | −8.7% | −30.0% | −39.3% | 0.0% |
Ether adds one thing bitcoin’s record does not contain: four-year windows that ended in a loss. Of its 2,335 four-year windows, the lump sum finished under water on 10.9%, the 12-month schedule on 6.2% and the 24-month schedule on 3.8%. Bitcoin has no losing four-year window at all so far — a fact we have examined in detail elsewhere, including why three-ish independent observations cannot carry the weight usually placed on them. Ether is the reminder that the second asset in our index already breaks the rule the first one is famous for.
What this cannot tell you
- Thousands of start dates are not thousands of independent facts. As flagged at the top: the 5,095 one-year observations compress to roughly fourteen non-overlapping years, and the 4,000 four-year observations to about three. The tail statistics that carry this article rest on how a handful of genuine bear markets happened to unfold.
- The cash assumption is deliberately unkind to averaging. Also flagged above, and worth the second mention: undeployed money earning a real deposit rate would lift every DCA figure here, most of all on the 24- and 36-month schedules where more of the sum sits waiting for longer.
- Costs run the other way. Fees, spreads and the record-keeping of many small tax lots all scale with the number of purchases. None of it is in these numbers.
- A distribution of the past is not a distribution of the future. Fifteen years of one asset produced these shapes. Nothing guarantees the next fifteen produce them again, in either direction.
And the standing caveat that applies to everything on this site: the above describes historical outcomes. It is not a forecast, not a recommendation, and not personal financial advice — we do not know your horizon, your other holdings or what a bad year would do to the rest of your life, and those are the inputs that actually decide this.
Using it
The useful reading is not “lump sum wins” or “DCA wins”. It is that the record prices the trade at every length, and the price is legible: the first year of averaging bought most of the tail protection that was available, the third bought the least and cost the most. What no table settles is the part stated at the top of this article — the size of the sum next to everything else you own, and whether the position would survive its worst day rather than its median one.
Three companion pieces do the parts this one skips. The DCA guide covers the mechanics — schedules, fees, splitting between the two assets, and how long a real position has spent under water. The drawdown census catalogues the falls that produce the left tail above. And the DCA calculator will run your own sum, start date and schedule against the same closes, with the lump-sum comparison switched on beside it.
Frequently asked questions
Is it better to buy bitcoin all at once or spread the purchases?
On this price history, buying all at once produced more money at most start dates: it finished ahead on 70.2% of one-year windows and 83.2% of four-year windows. Those two figures use the DCA calculator’s schedule — weekly purchases spread across the whole window, 53 buys in a year and 209 in four — which is a different schedule from the fixed 12 or 24 purchases used in this article’s tables, so the percentages are not expected to match. Spreading purchases produced smaller worst cases instead. Which matters more depends on the size of the sum relative to the rest of your finances, not on the data — and this is a description of the past, not advice.
How much did a lump sum lose in a bad first year?
Across 5,095 bitcoin start dates, the money committed all at once was worth less than half of itself at some point in the first twelve months on 23.0% of them, and the worst start date — 16 December 2017 — bottomed 83.2% below what was put in. At the median start date the low was 18.2% below the sum committed.
How much does averaging reduce the worst case?
Splitting the same sum into twelve monthly purchases cut the share of start dates whose commitment ever halved inside a year from 23.0% to 4.0%, and the fifth-percentile low from −70.4% to −47.2%. Twenty-four monthly purchases removed the halving cases from the record entirely, with a worst case of −32.9%. Undeployed cash is assumed to earn nothing.
Does averaging over a longer period work better?
It narrows the tail further and costs more. Stretching from twelve to twenty-four months improved the fifth-percentile first-year low by another 23.6 percentage points; stretching to thirty-six months added only 7.9 more while raising the lump sum’s median four-year advantage from 82.5% to 124.4%. On this record the first year of spreading was the efficient part of the trade.
Does the same hold for ether?
The ordering holds, the levels are worse. Across 3,430 ether start dates the lump sum’s median first-year low was −36.0% against −17.4% for a twelve-month schedule, and 31.5% of start dates saw the commitment halve within the year against 9.7%. Ether also has losing four-year windows — 10.9% of them for a lump sum — which bitcoin’s record so far does not.
Do these results include fees and taxes?
No. All figures are raw daily UTC closes with no fees, spreads or taxes, and undeployed cash earning nothing. Costs count against the averaging schedules more than the lump sum, since every instalment is another purchase and another tax lot; deposit interest on waiting cash would count the other way.