
Rebalancing a Bitcoin and Ether Portfolio: What It Actually Did
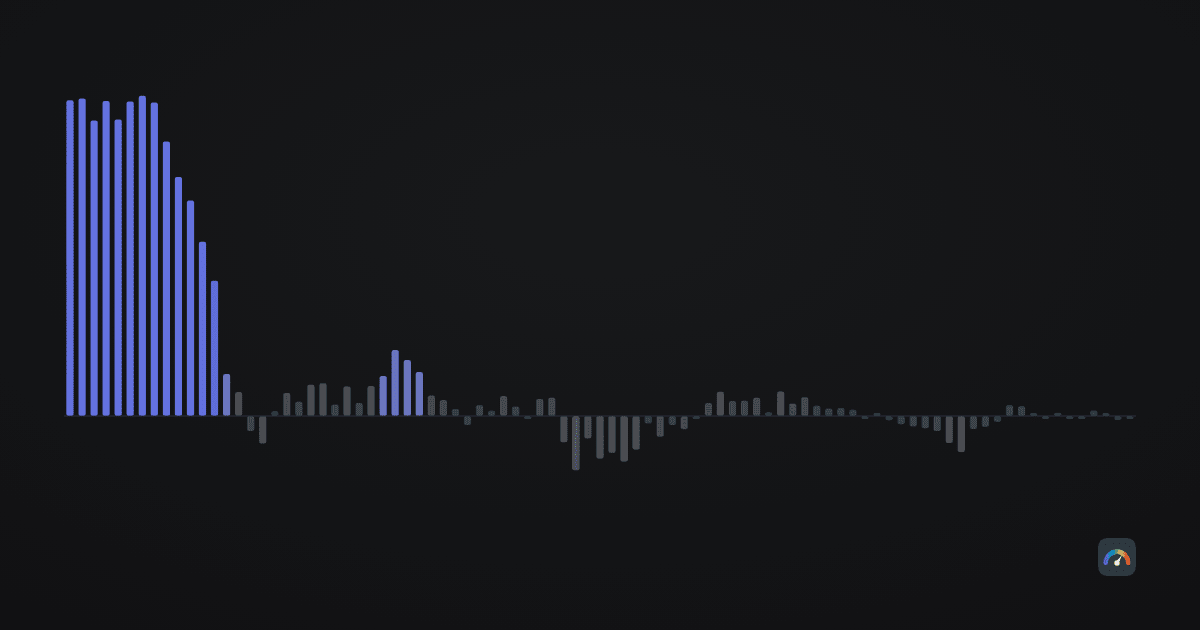
Over the one decade in which both coins have prices in our data, rebalancing beat leaving the portfolio alone, and not narrowly. A 70% bitcoin / 30% ether portfolio reset at the start of every January turned one unit into ×361.9 between 9 March 2016 and 29 July 2026. The same portfolio, bought once and never touched, reached ×159.5. That comparison is the headline, and it is also the least trustworthy sentence in this article.
Cut the same decade into three non-overlapping three-year stretches — three consecutive blocks of time that share no days with each other — and the advantage appears in exactly one of them. Against buy-and-hold, the quarterly-rebalanced portfolio ended 83.6% richer over 2016–2019, 5.1% richer over 2019–2022, and 4.6% poorer over 2022–2025.
Widening that from three blocks to every three-year stretch in the data gives the same split. Across all 89 overlapping three-year windows the rebalanced portfolio finished ahead in 64.0% of them — but 34 of those 89 windows begin in the 2016–2018 period that produced the whole advantage. The other 55, the ones that begin in January 2019 or later, are a subset of the same 89, and there the win rate is 47.3% with a median gap of −0.3%. On a three-year view, rebalancing two coins against each other has been a bet on their relative price coming back, not a discipline that pays in every period.
Short version: over this decade, resetting bitcoin against ether paid — but it paid because the two coins’ relative price kept coming back, not because resetting is profitable in itself. It did not make the position calmer: the worst fall was around 85% either way. What it did change is how much you sell, and selling is where tax lives — the one cost this article cannot compute.
The second surprise is where the risk reduction is and is not. Between bitcoin and ether, rebalancing barely moved the ride: annualised volatility ran 69.8–73.1% across the schedules against 72.1% for buy-and-hold, and the worst peak-to-trough fall improved from −87.5% to between −83.6% and −84.6%. Between bitcoin and cash it did something entirely different: a 50/50 mix reset once a year cut the worst fall from −83.2% to −56.5%, and cut the ten-year result from ×154.8 to ×61.5. Those two findings are the two halves of what follows. Everything here is a description of what happened in one decade of two assets — not a forecast, and not a recommendation for anyone’s portfolio.
How this was tested
The target mix is 70/30, the same weighting the Hodlometer Index uses for the pair, so the portfolio in this article and the index on the front page describe the same two-asset world. That is a reason of convenience, not of merit: 70/30 is how our index happens to be built, and nothing below tests whether it is a sensible target for a person to hold. Read what follows as being about the act of resetting, not about the number 70. All figures come from our own daily UTC closes (see our methodology). Bitcoin and ether both have closes on 3,795 days, 9 March 2016 to 29 July 2026 — 10.4 years, which is the whole sample. Six rules were run over it:
- Buy and hold. Start at 70/30, never trade again.
- Monthly, quarterly, annual. Sell whichever coin has grown past its share and buy the other back to target, at the first close of each new month, of each January/April/July/October, or of each January. Calendar dates, not anniversaries of the purchase — that is how a person with a reminder actually does it.
- 5pp and 10pp bands. No calendar at all: check daily, and trade only when bitcoin’s share of the portfolio has drifted 5 (or 10) percentage points away from 70%.
Three deliberate simplifications. Fees and taxes are excluded from every headline run and handled separately below, because tax treatment differs so much between countries that one number would be wrong for almost every reader. “Cash” is modelled at exactly zero return — a real deposit or short-dated bond would have earned something, so the cash mixes below are drawn at their least flattering. And a rebalance is assumed to happen at that day’s close, in full, without slippage.
What one window says
| Rule | Rebalances a year | Ending multiple | Volatility | Worst fall |
|---|---|---|---|---|
| Buy and hold | 0 | ×159.5 | 72.1% | −87.5% |
| Monthly | 11.9 | ×305.3 | 70.4% | −83.6% |
| Quarterly | 4.0 | ×351.5 | 71.2% | −84.6% |
| Annual | 1.0 | ×361.9 | 73.1% | −84.5% |
| 5pp band | 6.2 | ×277.2 | 70.0% | −84.1% |
| 10pp band | 1.9 | ×286.2 | 69.8% | −84.2% |
Three things stand out. Every schedule beat buy-and-hold over this window. The best one over this particular decade was the laziest — annual resets, ten swaps in ten years, ×361.9. But that ordering is a property of this one window, not of the schedule: over the 113 rolling one-year windows further down, monthly rebalancing has the highest median edge of any rule (+1.3%) and the highest win rate (65.5%), while annual has the lowest median of the three calendar rules (+0.1%). Change the horizon and the ranking reverses. And the risk columns barely moved: the difference between the calmest schedule and buy-and-hold is 2.3 points of volatility and about 3 points on a fall of roughly 85%. A portfolio that loses 84.6% instead of 87.5% is not a portfolio someone experienced differently.
What drove the return gap is drift. Left alone, the 70% bitcoin share climbed to 89.1% on 27 December 2016 and then collapsed to 30.4% by 12 June 2017, at the top of ether’s first mania, before wandering back to 67.9% by the end of the window. A rebalanced portfolio was selling ether into that spike and buying it back afterwards. That is the entire mechanism, and it depends completely on the spike being followed by a return.
The volatility column deserves more than a glance, because it contradicts the usual reason people give for rebalancing. Over the same decade, bitcoin held on its own ran at 67.7% annualised volatility with a worst fall of −83.2% (both from the cash table further down, measured on the identical window). The 70/30 mix left alone ran at 72.1% and −87.5%, and not one of the five schedules pulled either figure back below bitcoin’s own. Adding ether to bitcoin made the portfolio bumpier, not calmer, and no schedule undid that. So if the appeal of rebalancing is that it should make the position easier to sit through, this decade did not deliver it — for the reason set out further down: the two coins mostly fall on the same days.
The same test on every other window
One run over one decade is one observation. So the same simulation was repeated on every three-year window that fits in the data, stepped one month at a time — 89 of them — and the result plotted against the month each window starts. That stepping is what “rolling window” means below: the same three-year test slid forward a month at a time, so any two neighbouring windows share all but a month of their days.
The shape is the article. All ten windows that start during 2016 land between +63.3% and +84.8%, the best being the three years from September 2016. Windows starting in 2017 already contain losses, and from mid-2017 onward the line sits near zero and crosses it repeatedly, bottoming at −14.4% for September 2019 to September 2022. Split at January 2019 the two halves barely look like the same test:
| Rule | 34 windows starting 2016–2018 | 55 windows starting 2019 or later |
|---|---|---|
| Monthly | ahead in 100.0%, median +17.4% | ahead in 49.1%, median −0.2% |
| Quarterly | ahead in 91.2%, median +11.1% | ahead in 47.3%, median −0.3% |
| Annual | ahead in 94.1%, median +18.0% | ahead in 47.3%, median −0.8% |
| 5pp band | ahead in 100.0%, median +15.8% | ahead in 49.1%, median −0.1% |
| 10pp band | ahead in 97.1%, median +24.3% | ahead in 52.7%, median +0.2% |
Holding period changes the answer as much as start date does. Over one-year windows the schedules are close to a coin flip — 40.7% to 65.5% depending on the rule, with median gaps of 1.3% or less. Over five-year windows they win almost everything.
The five-year row deserves the least confidence of anything in this article, and the caution is arithmetic rather than modesty. The data span 10.4 years, which holds about two five-year periods that do not overlap. Sixty-five windows sounds like sixty-five tests, but neighbouring windows share four years and eleven months of the same days, and stacked up they describe roughly two independent five-year stretches of market. So what looks like 65 results is closer to two results, read 65 times over. What can be said is narrower: over five-year horizons, the advantage did not disappear in the later half of the sample — for windows starting in 2019 or later, quarterly rebalancing was ahead in all 31 of them, median gap +10.2%. It is a real pattern in this decade; it is not 65 pieces of evidence.
The cleanest way to see how little independent evidence there is: lay consecutive three-year blocks end to end, so that no block shares a single day with another, and there are only three of them to look at.
| Three years | Buy and hold | Quarterly | Annual |
|---|---|---|---|
| Mar 2016 – Mar 2019 | ×10.36 | ×19.02 (+83.6%) | ×18.37 (+77.3%) |
| Mar 2019 – Mar 2022 | ×12.82 | ×13.48 (+5.1%) | ×15.07 (+17.5%) |
| Mar 2022 – Mar 2025 | ×1.72 | ×1.65 (−4.6%) | ×1.64 (−5.2%) |
Those three blocks are not the whole decade, and a section arguing that independent evidence is scarce has no business quietly dropping the most recent evidence it has. They cover 3,290 of the 3,795 days in the sample — 86.7% — and stop on 11 March 2025. The remaining 505 days, 12 March 2025 to 29 July 2026, are 16.6 months: too short to be a fourth block, so they are not in the table. In them both versions of the portfolio lost money — buy-and-hold ended at ×0.83, the quarterly-rebalanced one at ×0.85, a gap of +2.2% in rebalancing’s favour on a stretch where there was less to divide.
What it costs to run
Rebalancing is not free, and the price comes in three currencies: trades, tax, and attention. Only the first can be tabulated, and it is also the smallest — so it comes last here.
Tax comes first because it is the only cost here that can actually bind. Every rebalance is a disposal, and in most countries a disposal is a taxable event that resets a tax lot: a schedule that sells 39% of a portfolio a year is a very different proposition from one that sells 13%. How much that costs depends on the jurisdiction, on how long the position was held and on the rest of the return, which is why no tax figure appears anywhere in this article: any single number would be wrong for almost every reader. The consequence is that every multiple in every table above is a ceiling — what a real portfolio kept is that number minus something this article does not know.
One case deserves saying out loud, because the simulations do not cover it. Every run in this article rebalances from day one, so no single trade is large: the monthly schedule’s average swap moved 3.3% of the portfolio and even the annual one only 13.5%. A first rebalance after years of leaving it alone is a different event. Someone who bought 70/30 at the first close of January 2017 and never touched it would have been down to 39.1% bitcoin by 29 July 2026, and getting back to target means one swap worth 30.9% of the portfolio — realising in a single day whatever gain had accumulated on the leg being sold across nine and a half years. Across the seven January starting points from 2017 to 2023, that first catch-up reset ranges from 4.0% to 30.9% of the portfolio, median 11.5%, depending entirely on which year the position was opened. The tables above model the small-and-regular version. The catching-up version is a bigger, lumpier transaction, and nothing here measures what it costs.
Trading fees, by contrast, are measurable and turn out to be minor. Since we do not know anyone’s fee schedule, the last column below turns the question around and gives the break-even fee: the rate that would have to be charged on the sale leg and the purchase leg alike before the rule’s entire advantage over this window disappeared.
| Rule | Rebalances a year | Value sold a year | Break-even fee per leg |
|---|---|---|---|
| Monthly | 11.9 | 39.2% | 7.9% |
| Quarterly | 4.0 | 22.8% | 16.3% |
| Annual | 1.0 | 13.0% | 28.0% |
| 5pp band | 6.2 | 36.3% | 7.3% |
| 10pp band | 1.9 | 21.0% | 13.2% |
Two readings. The band rules concentrate trading rather than reduce it — the 5pp band acted 6.2 times a year against monthly’s 11.9 yet moved almost as much value, 36.3% against 39.2%, because it only acts once the portfolio has actually drifted. And spot exchange fees are a fraction of a percent, several multiples below every number in the last column, so on this window trading costs were nowhere near the binding constraint: at 1% per leg — high for a spot exchange — quarterly rebalancing still ended 110% above buy-and-hold rather than 120%. That exhausts what can be priced here, and it is the cheap part. The tax above cannot be priced, and for many readers it is the larger of the two by some distance.
The third currency is attention, and it is not in any table either. Rebalancing requires selling the asset that has just done well, in the month it has just done well — reliably the hardest trade to actually place.
Bitcoin and cash: the version that changes the ride
This section is for readers who hold cash alongside their coins; if you are fully invested with nothing to reset against, the chart and table below describe a portfolio you do not have. For everyone else: most holders do not run a two-coin portfolio, they run some crypto and some cash, and the question that actually matters is what an annual reset between the two did. Here the results point the opposite way from the coin pair, and the direction does not flip with the period the way the coin pair’s did.
| Portfolio | Ending multiple | Annualised | Volatility | Worst fall |
|---|---|---|---|---|
| 100% bitcoin | ×154.8 | 62.5% | 67.7% | −83.2% |
| 50/50, reset yearly | ×61.5 | 48.7% | 39.8% | −56.5% |
| 50/50, never reset | ×77.9 | 52.1% | 63.7% | −81.4% |
| 25/75, reset yearly | ×15.9 | 30.5% | 24.9% | −40.8% |
| 25/75, never reset | ×39.4 | 42.4% | 58.9% | −78.1% |
Read the two pairs of rows together, because the comparison people usually skip is the one that matters. Simply starting at 50/50 and forgetting about it did almost nothing for risk: the worst fall was −81.4% against bitcoin’s −83.2%, because after a decade in which bitcoin rose 154-fold, a portfolio that began half in cash was 99% bitcoin by the end. It was a bitcoin portfolio wearing a cash label. The annual reset is what kept the mix an actual mix, and that is where the −56.5% comes from.
What it charged for that: the 50/50 mix ended at ×61.5 against bitcoin’s ×154.8, and the 25/75 mix at ×15.9. In rolling windows the trade is one-directional — the 50/50 mix beat holding bitcoin alone in 15.7% of the 89 three-year windows and 18.5% of the 65 five-year windows; the 25/75 mix in 7.9% and 7.7%. Over the full bitcoin series back to 18 August 2011 the same shape holds: ×5,863.9 for bitcoin alone, ×1,935.0 for the yearly-reset 50/50 mix with a worst fall of −67.2%, ×267.1 for 25/75 with −60.5%. So the trade was one-way in this data: a materially shallower hole over both spans we can measure it on, paid for by giving up growth in 84.3% of the three-year windows and 81.5% of the five-year ones. Nothing here says which side of that trade a given person should want.
Why it helps in one regime and hurts in another
Rebalancing sells what has risen and buys what has fallen. If the relative price of the two things comes back, that is buying low and selling high on a schedule, and it pays. If one asset simply keeps beating the other, the same rule keeps cutting the winner and feeding the loser, and it costs. Nothing about the schedule decides which world you are in.
For bitcoin and ether over this decade, the world was the first kind — almost perfectly so. The ether-to-bitcoin price ratio started the window at 0.0271 and ended it at 0.0299, up about 10% in ten and a half years, having travelled from a low of 0.0077 on 27 December 2016 to a high of 0.1451 on 12 June 2017, a range of 18.7×. Enormous swings, no net drift: laboratory conditions for a rule that harvests swings. The two coins ended the window within a hair of each other in total terms, bitcoin ×154.8 against ether ×170.5.
The same closeness also caps how much rebalancing can ever do for risk here. Daily log returns of the two correlate at 0.696 across this window, and our separate study of that correlation finds it higher still — 0.797 — on the shorter window where both trade on one venue. Two assets that fall together on the same days cannot diversify each other; that is the arithmetic behind the comparison near the top of this article, where the 70/30 mix carried more volatility than bitcoin alone rather than less. It is also why the drawdown column in the first table hardly moves, and why the cash section moves it so much: cash is the only holding in this article uncorrelated with the rest — by construction, since we model it as a flat line.
What this does not say
The window is the binding limit. Ether’s price series starts on 9 March 2016, so there is no earlier test to run; 10.4 years contains roughly three independent three-year stretches and two independent five-year ones, and the largest single result in the article comes from one of them. A ratio that round-trips is what made rebalancing look good, and there is no rule saying the next decade’s ratio must round-trip. Had ether simply kept gaining on bitcoin, every table above would have inverted.
Four more things are missing on purpose. Fees appear only as a break-even threshold; taxes appear only as a warning and never as a number, and for many readers they will be the largest figure in the exercise. Cash earns nothing here, which understates both mixes by whatever a deposit would have paid. Intraday prices are invisible — one close per day, so the falls above are gentler than what someone watching live prices lived through, as our census of bitcoin drawdowns spells out. And no schedule was optimised: 70/30, monthly/quarterly/annual and 5/10-point bands were chosen before the results were seen, precisely so that the answer would not be the product of searching for a flattering one.
If you want to sit with the underlying series rather than the summary, the comparison tool plots bitcoin and ether against each other and against the S&P 500 and gold over several fixed windows, and runs the same rolling-window check on which asset won, and the DCA calculator answers the adjacent question — what regular buying, rather than periodic resetting, would have done. This article measured the past of two assets over one decade. It is not a forecast, not investment advice, and not a statement about what any particular person should hold.