
We Scored 766 Bitcoin Forecasts. A No-Change Guess Beat Them.
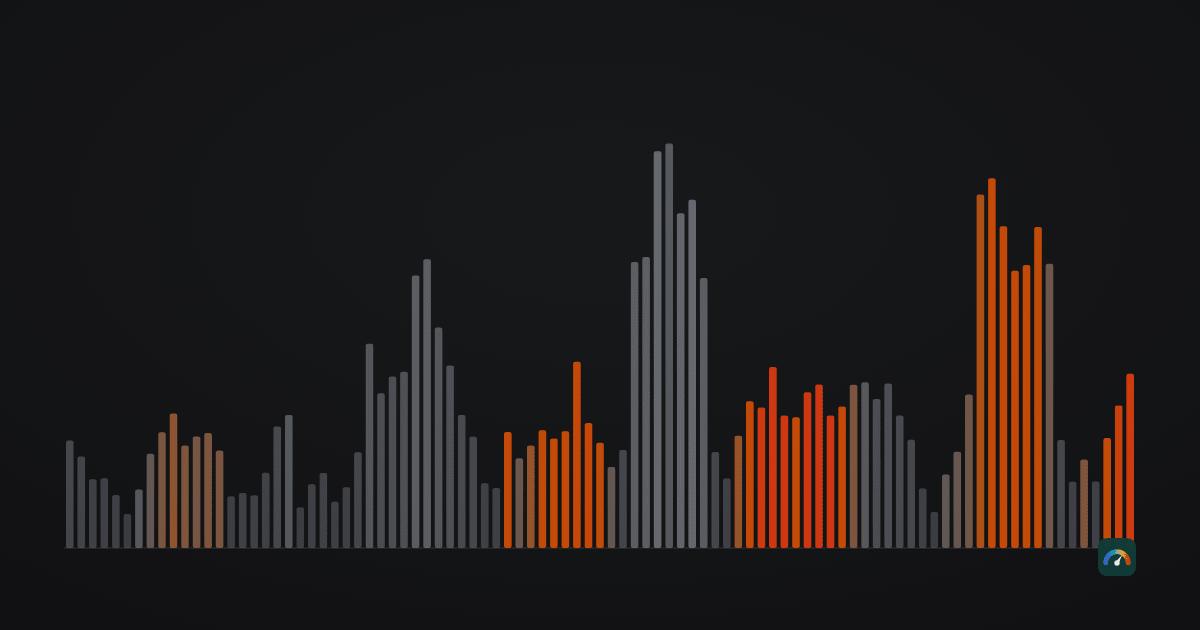
Bitcoin price forecasts are published by the thousand and scored by almost nobody. The forecast is a headline; the day it comes due is not. We publish price ranges ourselves, on the markets page, so the question points at us too — and we ran it: our statistical model was replayed over thirteen months of history and every forecast marked against what the price actually did.
The short answer, for anyone reading no further. Over 766 scored bitcoin forecasts, the model’s 30-day range contained the actual close 70.5% of the time. Its midpoint missed by a median of 10.25% — median meaning the middle forecast, half of them better and half worse.
Then we scored the laziest possible rival on the same dates: “the price in 30 days will be whatever it is today.” That guess missed by a median of 6.60%, and landed inside its range 76.9% of the time. The model lost to it on both counts, in all four asset–horizon combinations. One caveat belongs beside those numbers rather than at the foot of the page: this is a backtest — a replay computed after the fact on stored history, not forecasts published in real time.
If you read only this: before you weigh anyone’s bitcoin price target, ask what it beats. A forecast is only informative if it does better than “the price will be roughly what it is now” — and on our own thirteen months, ours did not. Ask for the hit rate, the sample size and the benchmark. If none of the three is offered, the number is a story.
Then why do we still publish a range?
That is the fair question to ask straight after an admission like this, so it gets answered here rather than at the foot of the page. A range and a midpoint are two different claims, and only one of them failed. The width of the band is a statement about how far bitcoin typically travels in a month — ordinary volatility, measured from the record, and it survives being checked. The midpoint is the part that says “and this is where it will be”, and that is the part with no edge over doing nothing.
So scoring the model changed how we present it rather than whether we present it — what changed, and by how much, is in the calibration section below. What we will not do is keep a midpoint that a free guess beats and let the presentation imply otherwise.
Everything below comes from our own daily UTC closes and the table that scores them (sources and definitions in our methodology): 1,532 scored forecasts — 766 bitcoin, 766 ether — from base dates between 22 June 2025 and 19 July 2026. This describes how one model performed over one stretch of one market. It is not a forecast, and nothing here is advice about buying or selling anything.
What “hit” and “error” mean here
Both are defined in code, not in prose, so there is nothing to argue about afterwards. Each forecast stores a low, a midpoint and a high for a target date; when that date arrives, the scorer takes the daily close and writes two numbers into the row:
- Hit is 1 if the close landed inside the published low–high range, endpoints included, and 0 otherwise. Nothing partial: a close one dollar outside is a miss.
- Error is |actual − midpoint| ÷ actual. Dividing by the actual rather than by the forecast matters: an earlier version divided by the forecast and quietly flattered the model on 30-day errors by about three percentage points.
The model is deliberately plain. It fits a straight line through the logarithm of the last 60 daily closes, carries that slope forward while damping it (the further out the target, the less of the trend survives), and puts a band around the result at ±1.28 × σ × √h — σ being the daily volatility of the last 30 days, h the days ahead. In plain words: take how much the price has been jumping about from day to day lately, stretch it for the number of days you are looking ahead, and draw the band that far above and below. The 1.28 is not decorative: under a normal distribution it is the multiplier that should enclose 80% of outcomes.
The scorecard
Four cells: two assets, two horizons. The benchmark columns are the “no change” forecast — same target date, same actual close, same band width, but centred on the last known price instead of a projected trend.
| Asset · horizon | Model: median error | No change: median error | Model: inside range | No change: inside range |
|---|---|---|---|---|
| Bitcoin · 7 days | 4.11% | 3.38% | 72.8% | 78.1% |
| Bitcoin · 30 days | 10.25% | 6.60% | 70.5% | 76.9% |
| Ether · 7 days | 6.21% | 5.52% | 75.1% | 78.9% |
| Ether · 30 days | 19.46% | 11.56% | 68.1% | 71.6% |
Stretching the horizon 4.3-fold, from seven days to thirty, grows bitcoin’s median error 2.5-fold, from 4.11% to 10.25%. Pure chance alone would have grown it less: uncertainty accumulates with the square root of time, and √(30/7) ≈ 2.07, so the realized ratio of 2.49 sits noticeably above that — about a fifth higher. Ether, the more volatile of the two, carries about 1.5 times bitcoin’s error at seven days and nearly twice at thirty; that link between volatility and error is the subject of our article on bitcoin’s volatility trend.
The benchmark that matters
A forecast that is merely “close” tells you nothing; the question is whether it beats the cheapest alternative. For prices that alternative is the random walk — the assumption that tomorrow’s price is today’s plus noise nobody can predict, so the best available guess for any future date is simply today’s number.
It is worth being blunt about why that comparison is the whole game. The no-change guess requires no data, no model, no judgement and no work; anyone can write it down in a second, for free. Everything a real forecast adds — a trend, a signal, an opinion about the cycle — is only worth the attention it asks for if it lands closer than that. Losing to it is not a near miss. It means the effort made the guess worse than not bothering, and the confident-sounding number is doing harm rather than nothing.
Forecast by forecast, the model came closer than “no change” on 155 of 393 bitcoin weeks (39.4%) and 110 of 373 bitcoin months (29.5%) — worse than a coin toss against a rival requiring no model at all. The gap is widest where it hurts: at 30 days the benchmark landed within 10% of the eventual price in 65% of cases against the model’s 49%, and within 5% in 44% against 19%.
The reason is the size of what is being added. The only difference between the two forecasts is the trend term, and at seven days it moves the midpoint a median of 1.24% off the last close, against a median actual move of 3.43%; at thirty days, 3.47% against 6.37%. A small, confident nudge — which over these thirteen months pointed the wrong way slightly more often than right at seven days (53% against 47%) and considerably more often at thirty (60% against 40%). That is enough to turn a small addition into a net cost.
One complication, because it cuts against the neatness of that. Two 30-day forecasts made a day apart are watching almost the same month: they share 29 of their 30 days. If that month goes badly, both are wrong for the same reason — that is one mistake counted twice, not two mistakes. So 373 rows are nowhere near 373 separate tests.
Keep only the forecasts whose windows do not touch at all and bitcoin is left with 57 independent weeks and just 13 independent months. At seven days the picture barely moves: 3.87% median error and 73.7% inside the range, against the benchmark’s 3.84% and 80.7%. At thirty days it points the same way — 12.13% against 6.04%, the model ahead on 5 of the 13 — but thirteen is a small sample, and we would rather call it small than dress it up as a percentage.
Accuracy is not a property, it is a weather report
A single headline hit rate hides what a reader most needs to know: whether that rate is steady. It is not.
The 30-day line spends most of the record above 80% and then falls through the floor twice. Forecasts based in January 2026 landed inside their range 9.7% of the time; those based in May 2026, 3.2%. February 2026 scored 100%. The average of those months describes none of them.
What happened is not mysterious. Bitcoin closed at $93,650 on 6 January 2026 and at $62,854 on 5 February 2026 — a fall of 32.9% in thirty days, on the closes as they stood when these rows were scored.
The forecast made on that January day put the midpoint at $91,077, in a range running from $82,600 to $100,424. It missed by 44.90%, the worst in the whole record, and the next four worst all point at the same few weeks. A smaller repeat came in early June, when $73,820 on 30 May 2026 became $60,862 by 6 June. Both are part of the 2025–2026 decline described in our article on bitcoin’s drawdown history.
In fairness to the model, on that worst forecast “no change” did worse still — 49.00% — because the damped downtrend at least leaned the right way. The benchmark wins the average, not every day.
Is the range worth anything?
A range claims how often reality will fall inside it, so it can be checked directly. The check has a name — calibration: comparing the confidence a forecast advertises against the share of times it delivers. The ±1.28σ√h band implies 80%. Realized: 72.8% at seven days, 70.5% at thirty — the nominal figure overstates by 7 and 9 percentage points. That is why the site never publishes the 80%; beside each range it shows coverage measured over the full price history, 76.2% and 69.1% for bitcoin when these rows were written. Those held here to within 3.4 and 1.4 points. If you check the live card today you will read 75.4% and 67.1% instead: the same measurement was re-run on 27 July 2026 after we backfilled bitcoin’s closes to 2011 and ether’s to 2016, and the extra years of history moved it slightly.
The headline number hides a worse problem, though. Split the forecasts by how wide their own band was — which, since width is set entirely by the volatility of the 30 days before the base date, is the same as splitting calm days from turbulent ones.
The pattern runs the wrong way round. When the band was narrow — the quarter of days on which a range looks worth reading, spanning 8–11% at seven days — it contained the actual close 47.5% of the time. When it was wide enough to be nearly uninformative, 91.8%. At thirty days the split reads 45.7% against 90.3%. The overall 72.8% is the average of a band too tight when the market is quiet and too loose when it is not — and quiet markets do not stay quiet: the calm 30 days that produce a narrow σ are exactly the setup for an expansion the band has not priced. What the options market charges for that risk is the forward-looking version of the same question, covered in our article on implied volatility and DVOL.
Stated plainly: on the days the range would have been useful, it was wrong more often than right.
Direction is the weakest column of all
Each forecast also carries a label — up, down or flat — set by whether the midpoint sits more than 1.5% above or below the last close, with the outcome scored by that same 1.5% rule. There are two different questions to ask of those labels, and they have different pass marks. It is worth keeping them apart, because the two answers look contradictory at a glance and are not.
First question: does the label match what happened? Three possible answers, so blind guessing scores about 33%. Over 393 bitcoin weeks the label matched 25.4% of the time; over 373 months, 21.2%. Writing “down” on every single row without looking at anything would have scored 40.5% and 51.7%.
Second question: when the model commits, is it right? Throw away every row where the call or the outcome was “flat” and what remains is a straight two-way bet, so the pass mark is 50%. On the 127 weeks and 218 months left, the model was right 40.9% and 33.5% of the time.
Different denominators, different bars to clear — and the model is under the bar on both.
Below 50% on a two-way call is worse than random, and here it has a plain cause: the model extrapolates the last 60 days of trend, and across these thirteen months bitcoin’s short trends reversed more often than they continued. That is a property of one falling market, not a law — but it is why “the trend has been up, so it will continue” is the cheapest sentence in crypto commentary.
What we checked before publishing this
A backtest is worthless if the model can see the future while being tested. The standard failure is look-ahead bias — letting data that only existed later leak into a forecast supposed to predate it. We audited all 1,572 rows against their own stored inputs:
- Zero rows have a regression or indicator window ending after their base date. The price loader is filtered to closes on or before that date, so trend, volatility and every indicator come from data that existed on the day.
- Zero rows carry cycle indicators, which are computed as of today and switched off in backtest mode for exactly this reason.
- All 1,572 rows carry a Fear & Greed reading dated 26 July 2026 — the day the backtest was run, not the base date. This is a genuine leak and we are naming it: the value appears only in the human-readable rationale sentence, never in the midpoint, the band, the direction or the score. The prose is contaminated; the arithmetic is not.
- One parameter is not clean. The damping constant deciding how much trend survives the horizon was tuned on the whole price history, these thirteen months included. Tuning that saw the test period flatters a model rather than penalising it — so a genuinely out-of-sample version of this test would go no better for ours than what you see above.
What this test cannot tell you
- A backtest is not a live track record. Nobody stood behind these forecasts on the day. Real publication adds pressure, revisions and the temptation to quietly re-run a bad one, none of which a replay reproduces.
- Thirteen months, one regime. Over this window bitcoin set a record close of $124,740 on 6 October 2025 and then spent most of the period falling. A model that extrapolates trends looks different in a market that trends, and two months carry much of the damage: January and May 2026 hold 58 of bitcoin’s 110 misses at 30 days.
- One model, and a simple one. Nothing here judges anyone else’s method, or the AI-generated ranges we publish alongside this one — those have far too few scored rows to judge, and are marked as such on the site.
- Overlapping forecasts inflate every count. 393 and 373 are row counts, not independent observations; the honest figures are about 57 and 13. Every share in this article inherits that.
- Scored closes drift a little. Prices are refreshed daily from our sources, so a row scored in July sits a median 0.04% from today’s value of that same close. Re-running the comparison on today’s series moves bitcoin’s median errors by under 0.2 points and changes nothing here.
- So does the benchmark’s starting price. The same drift touches the other end of the comparison, and this one is easy to miss: “no change” is centred on today’s stored close for the base date, not on the exact figure the model read that morning. Across all 1,532 rows the two differ by a median of 0.04%, a mean of 0.14% and at most 5.5%. Re-centring the benchmark on what the model actually saw moves bitcoin’s no-change median error from 3.38% to 3.45% at seven days and from 6.60% to 6.57% at thirty, leaves both of bitcoin’s hit rates unchanged, and shifts the head-to-head count by at most three rows in any of the four cells. No cell changes hands.
How to read someone else’s bitcoin forecast
The useful part is not our scorecard but the questions it makes obvious, and they work on any forecast you meet.
Ask what it beats. Not “was it close” — close is easy. A 30-day bitcoin forecast landing within 10% of the price sounds respectable until you learn that “no change” managed it 65% of the time over the same dates.
Ask how many, and how independent. “Right eight times” means little if those eight calls overlap. A forecaster with a year of daily 30-day calls has roughly twelve independent chances, not 365.
Distrust the narrow range hardest. A tight band is the most persuasive thing a forecaster can show you and, in our record, the least reliable: the narrowest quarter of our own ranges was wrong more than half the time.
Notice which numbers are asserted and which are measured. “80% confidence interval” is a property of a formula. “The last 373 of these contained the price 70.5% of the time” is a property of the world. The second is checkable; the first is a choice of multiplier.
None of this makes price models useless. It fixes what they are for, which is where we came in: a band describes ordinary volatility, not knowledge of the future. A forecast that cannot beat “roughly today’s price” is not a reason to change what you were going to do anyway — and that goes for ours as much as for the ones in your feed.
Frequently asked questions
How accurate are bitcoin price forecasts?
For the one model we can score properly — our own — the answer over 766 scored bitcoin forecasts from 22 June 2025 to 19 July 2026 is: the 7-day range contained the actual close 72.8% of the time with a median midpoint error of 4.11%, and the 30-day range 70.5% with a median error of 10.25%. Those are backtest figures, computed after the fact rather than published live. The more useful comparison is that assuming no change at all beat both: 3.38% and 6.60% median error, 78.1% and 76.9% inside the range.
What is a random walk benchmark and why does it matter?
A random walk assumes tomorrow’s price is today’s price plus unpredictable noise, so the best available forecast for any future date is simply today’s price. It costs nothing to produce, which is exactly why it is the bar any real forecast has to clear. Over our thirteen-month window the model beat it on only 155 of 393 bitcoin weeks and 110 of 373 bitcoin months.
Can a price model predict the direction of bitcoin?
Ours did not. Over 393 bitcoin weeks its up/down/flat label matched the outcome 25.4% of the time, below the 33% of a random pick and below the 40.5% of writing ‘down’ on every row; over 373 months it scored 21.2%. Restricted to cases where both the call and the outcome were decisive, it was right 40.9% at seven days and 33.5% at thirty. The model extrapolates the last 60 days of trend, and over this stretch bitcoin’s short trends reversed more often than they continued.
Why is a forecast range sometimes too narrow?
Because the width is set by recent volatility, and volatility clusters. Splitting our bitcoin forecasts into four groups by their own range width, the narrowest quarter — produced on the calmest days — contained the actual close only 47.5% of the time at seven days and 45.7% at thirty, while the widest quarter contained it 91.8% and 90.3%. The band is tightest exactly when the market is most likely to be about to leave it.